
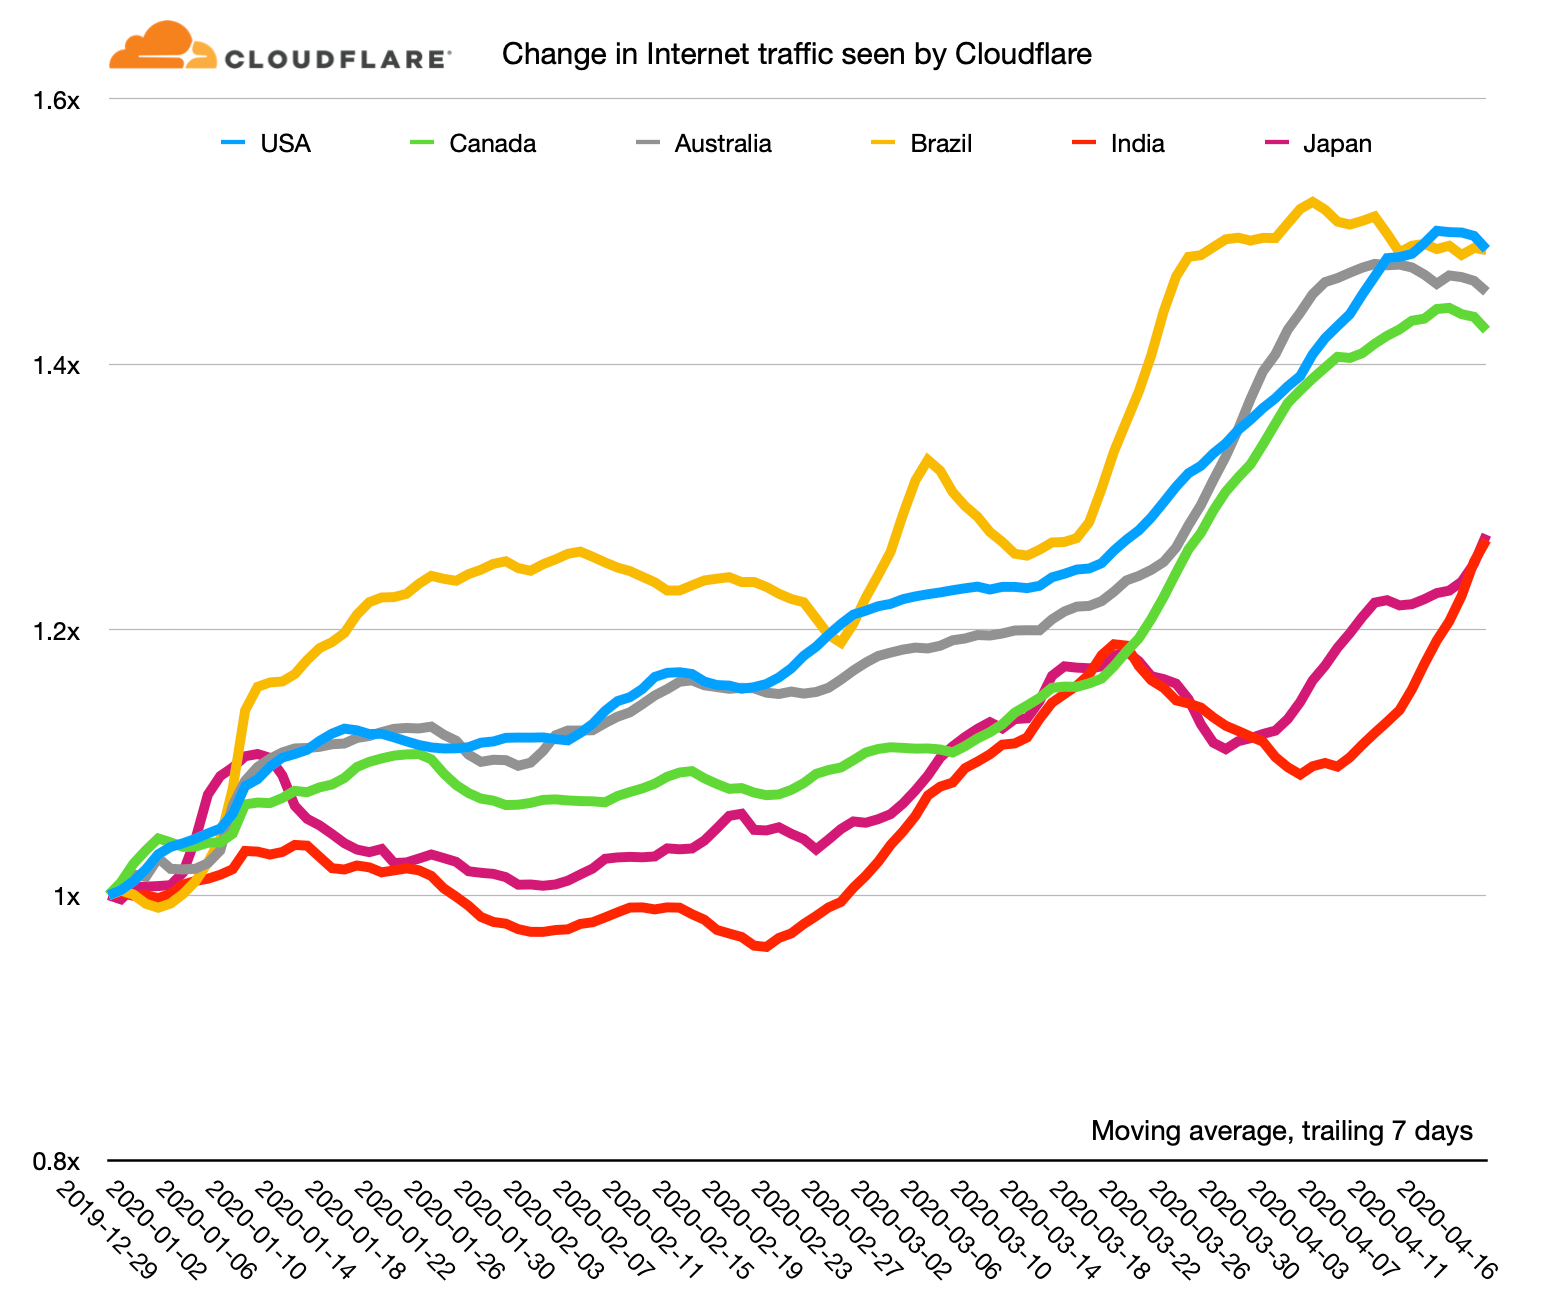
Recent news about the Internet has mostly been about the great increase in usage as those workers who can have been told to work from home. I've written about this twice recently, first in early March and then last week look at how Internet use has risen to a new normal.
As human behaviour has changed in response to the pandemic, it's left a mark on the charts that network operators look at day in, day out to ensure that their networks are running correctly.
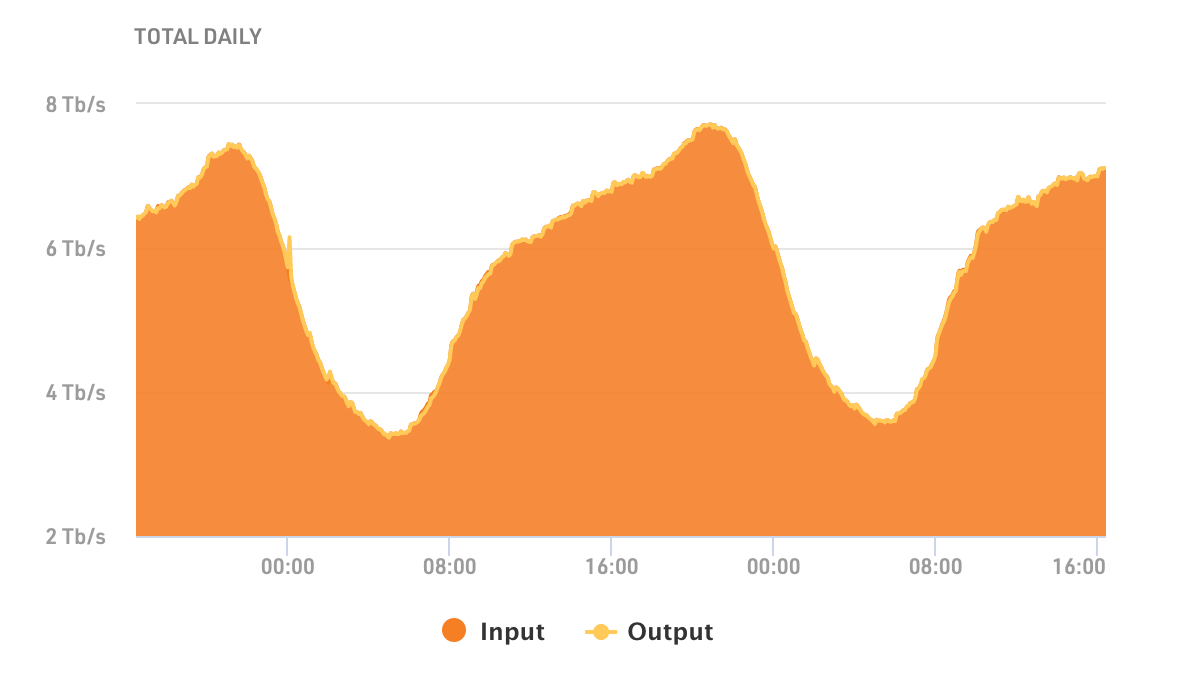
Most Internet traffic has a fairly simple rhythm to it. Here, for example, is daily traffic seen on the Amsterdam Internet Exchange. It's a pattern that's familiar to most network operators. People sleep at night, and there's a peak of usage in the early evening when people get home and perhaps stream a movie, or listen to music or use the web for things they couldn't do during the workday.
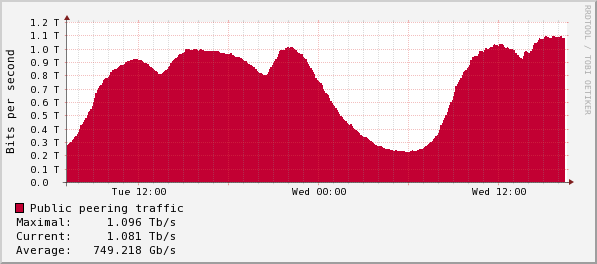
But sometimes that rhythm get broken. Recently we've seen the evening peak by joined by morning peaks as well. Here's a graph from the Milan Internet Exchange. There are three peaks: morning, afternoon and evening. These peaks seem to be caused by people working from home and children being schooled and playing at home.
But there are ways human behaviour shows up on graphs like these. When humans pause the Internet goes quiet. Here are two examples that I've seen recently.
The UK and #ClapForNHS
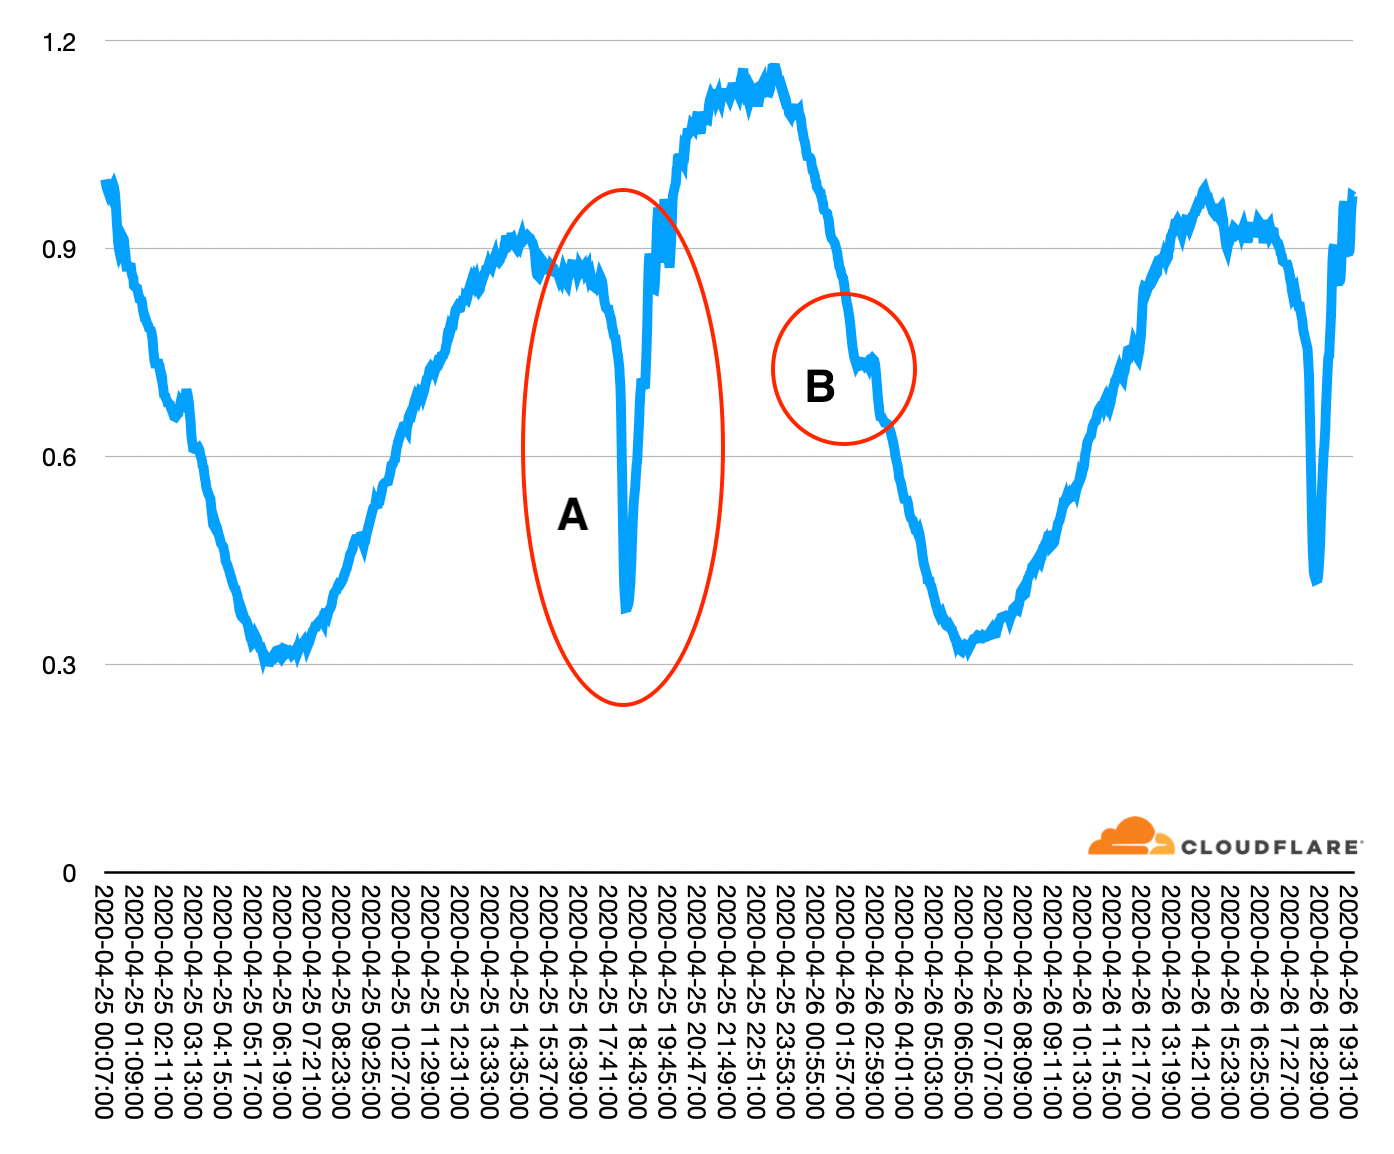
Here's a chart of Internet traffic last week in the UK. The triple peak is clearly visible (see circle A). But circle B shows a significant drop in traffic on Thursday, April 23.
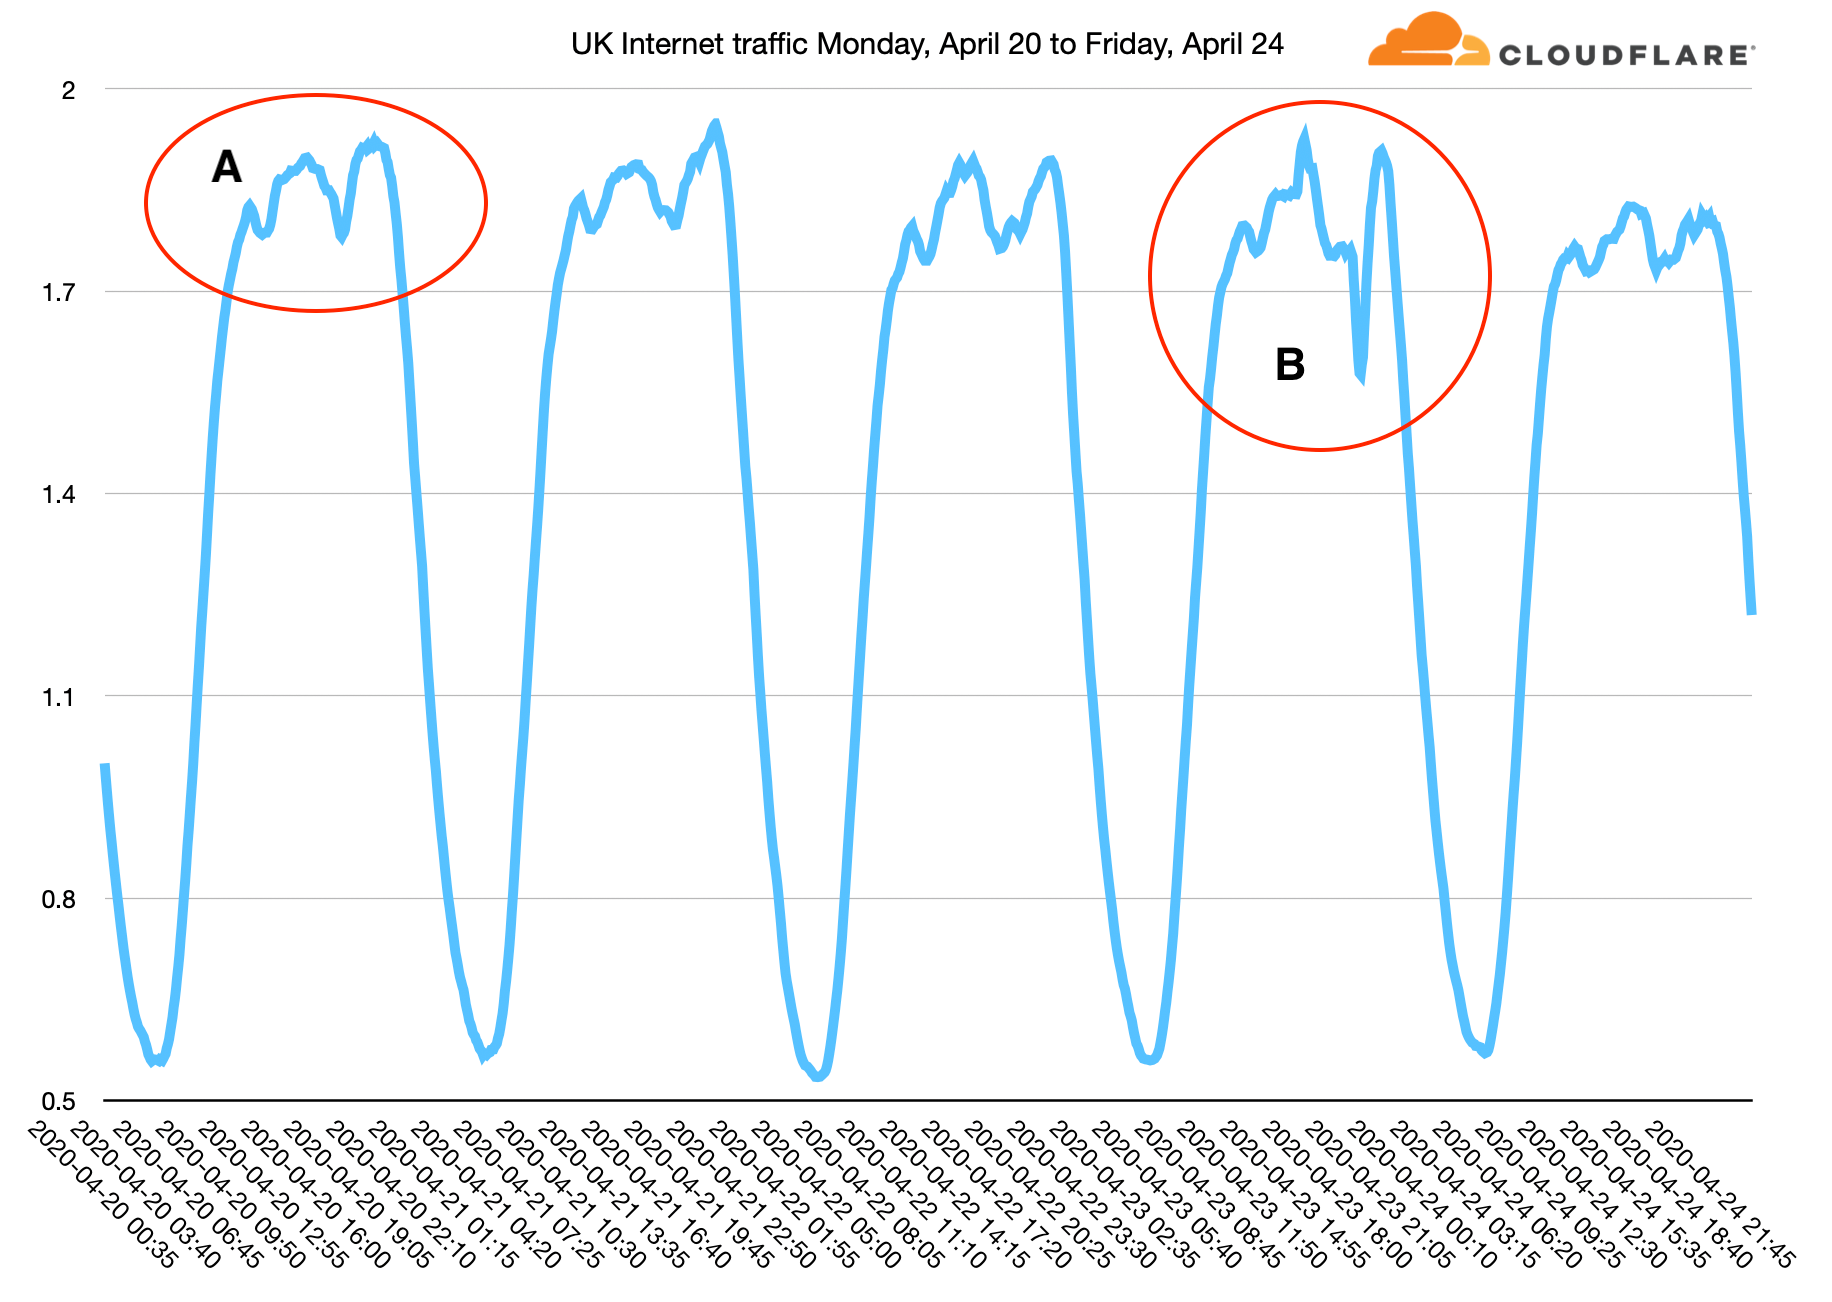
That's when people in the UK clapped for NHS workers to show their appreciation for those on the front line dealing with people sick with COVID-19.
Ramadan
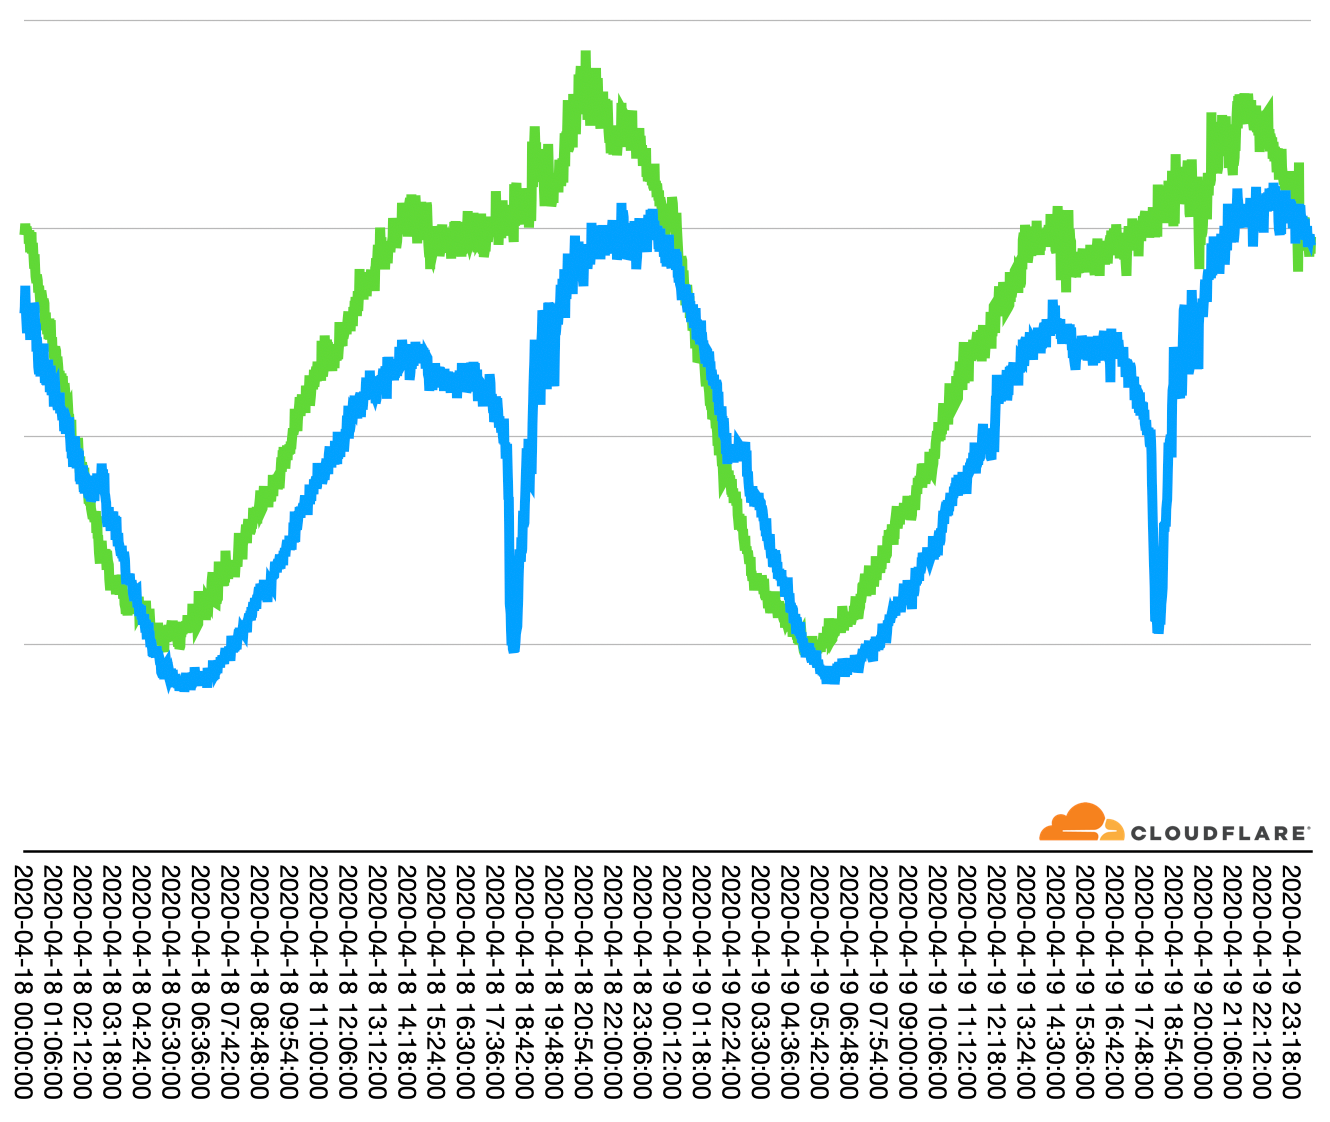
Ramadan started last Friday, April 24 and it shows up in Internet traffic in countries with large Muslim populations. Here, for example, is a graph of traffic in Tunisia over the weekend. A similar pattern is seen across the Muslim world.
Two important parts of the day during Ramadan show up on the chart. These are the iftar and sahoor. Circle A shows the iftar, the evening meal at which Muslims break the fast. Circle B shows the sahoor, the early morning meal before the day's fasting.
Looking at the previous weekend (in green) you can see that the Ramadan-related changes are not present and that Internet use is generally higher (by 10% to 15%).
Conclusion
We built the Internet for ourselves and despite all the machine to machine traffic that takes place (think IoT devices chatting to their APIs, or computers updating software in the night), human directed traffic dominates.
I'd love to hear from readers about other ways human activity might show up in these Internet trends.