

There are events that unite people, like a total solar eclipse, reminding us, humans living on planet Earth, of our shared dependence on the sun. Excitement was obvious in Mexico, several US states, and Canada during the total solar eclipse that occurred on April 8, 2024. Dubbed the Great North American Eclipse, millions gathered outdoors to witness the Moon pass between Earth and the Sun, casting darkness over fortunate states. Amidst the typical gesture of putting the eclipse glasses on and taking them off, depending on if people were looking at the sky during the total eclipse, or before or after, what happened to Internet traffic?
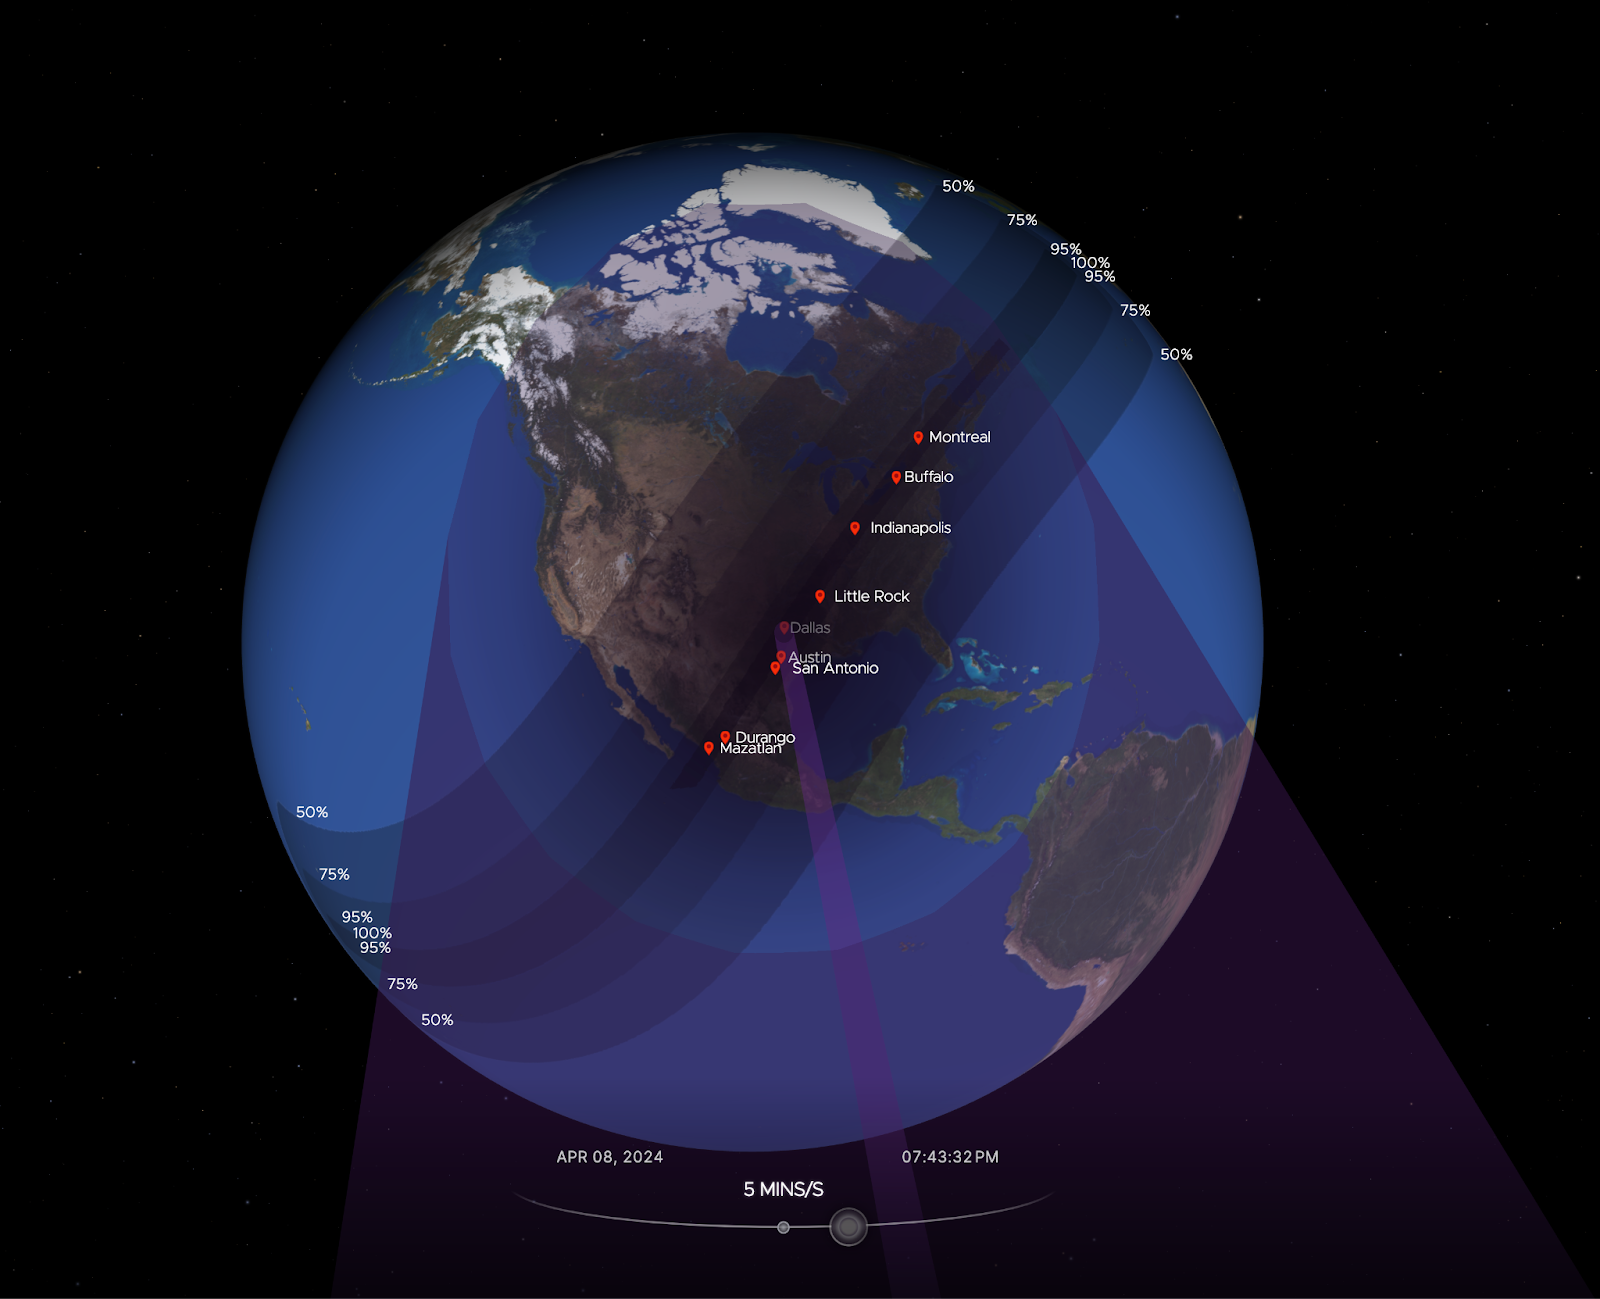
Cloudflare’s data shows a clear impact on Internet traffic from Mexico to Canada, following the path of totality. The eclipse occurred between 15:42 UTC and 20:52 UTC, moving from south to north, as seen in this NASA image of the path and percentage of darkness of the eclipse.
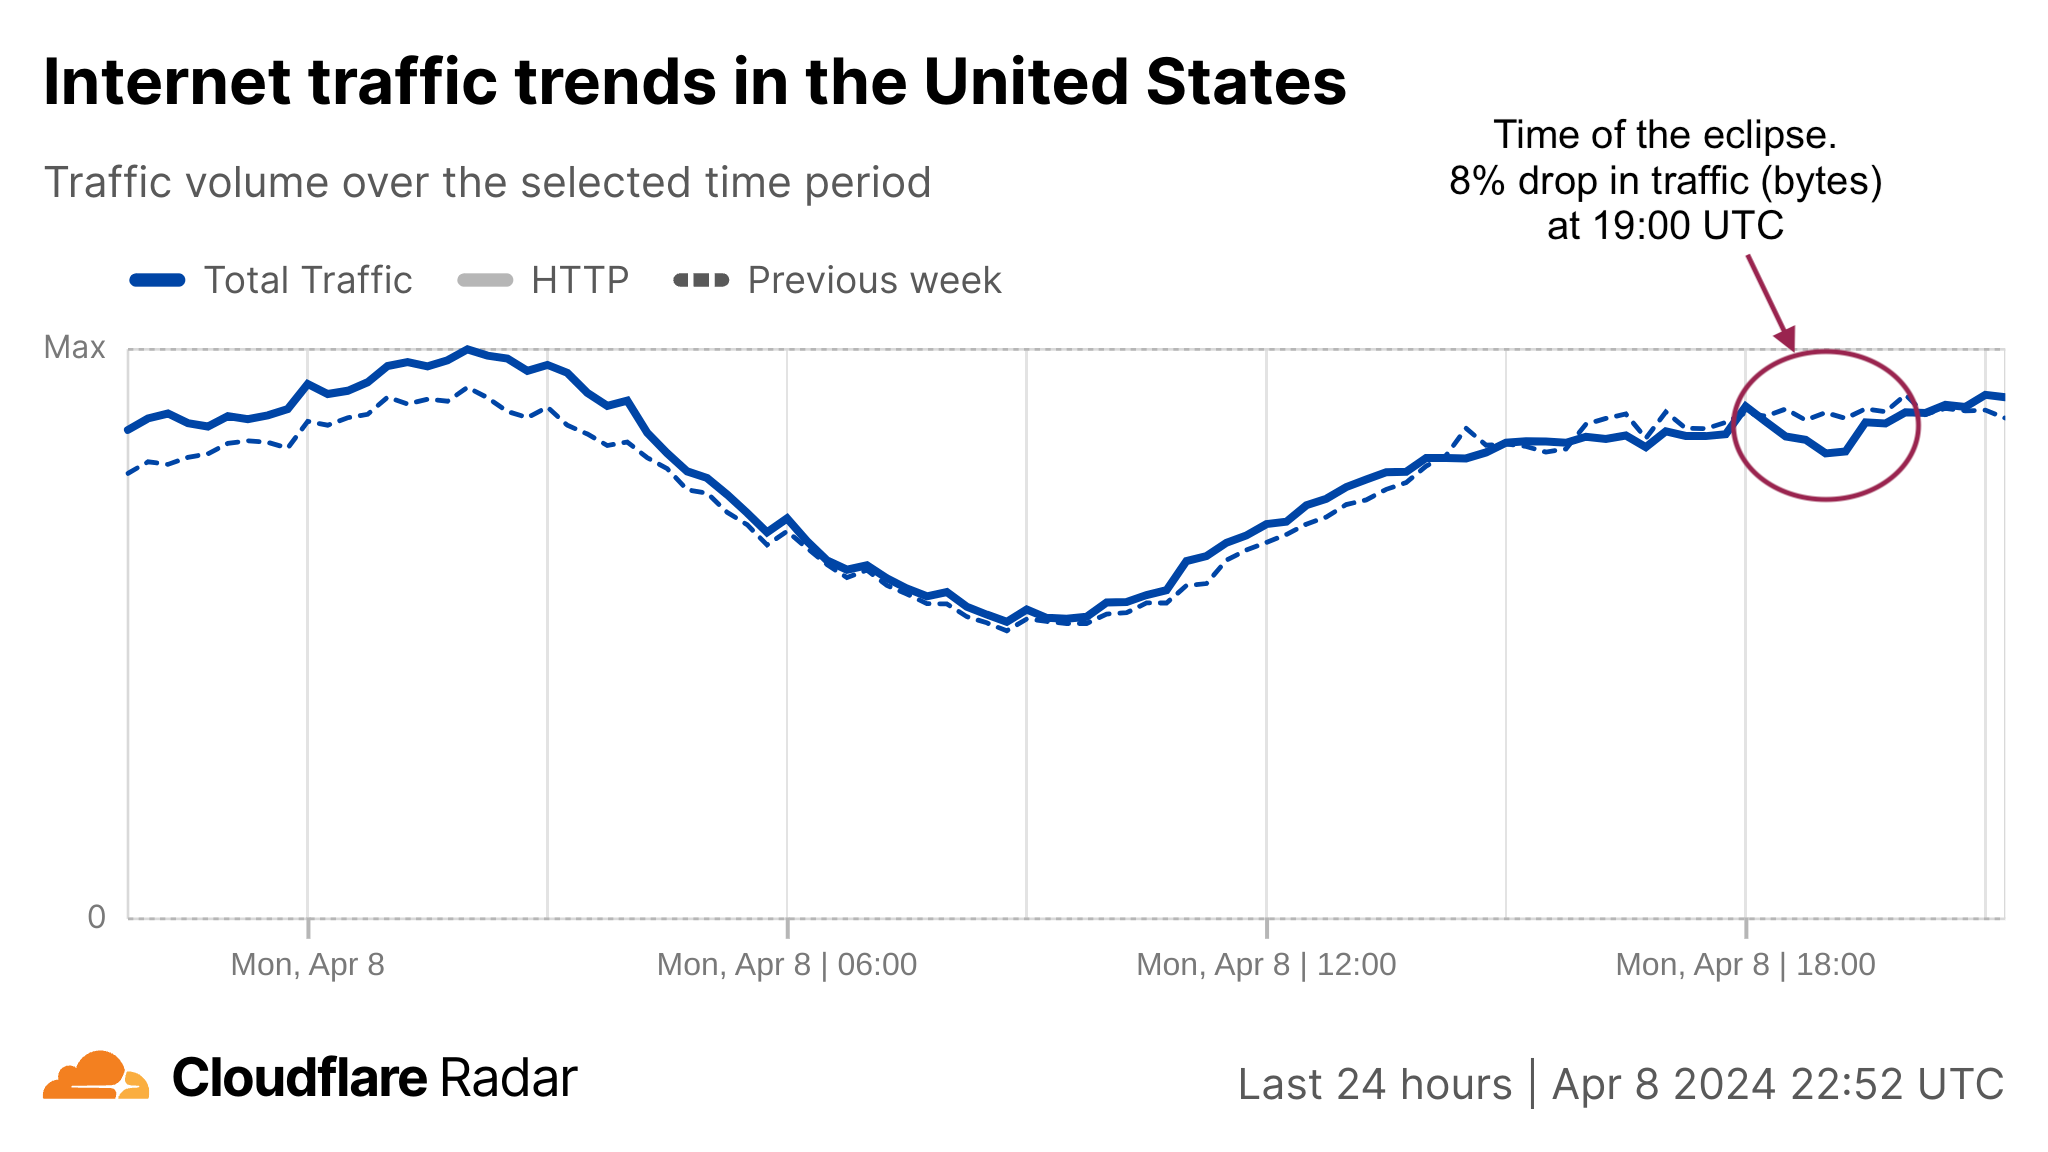
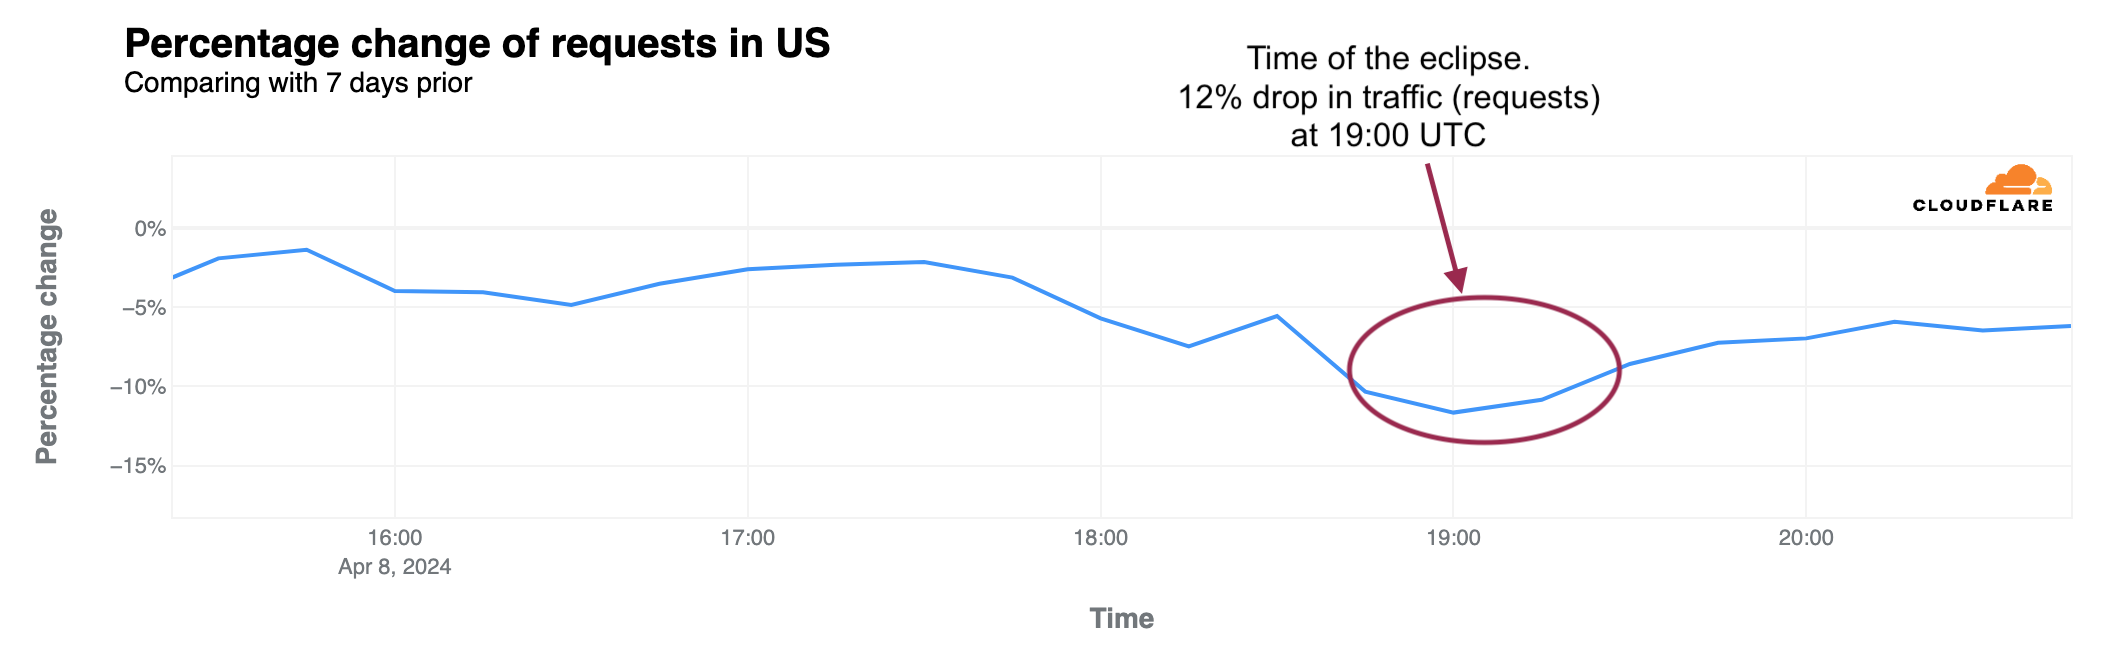
Looking at the United States in aggregate terms, bytes delivered traffic dropped by 8%, and request traffic by 12% as compared to the previous week at 19:00 UTC (14:00 Eastern, 12:00 Pacific).
The state-level perspective in terms of traffic drop at the time of the eclipse, as compared to the previous week, is much more revealing. Here’s a summary of the US states' traffic changes. We can almost trace the path of the eclipse, as shown in the previous NASA image.
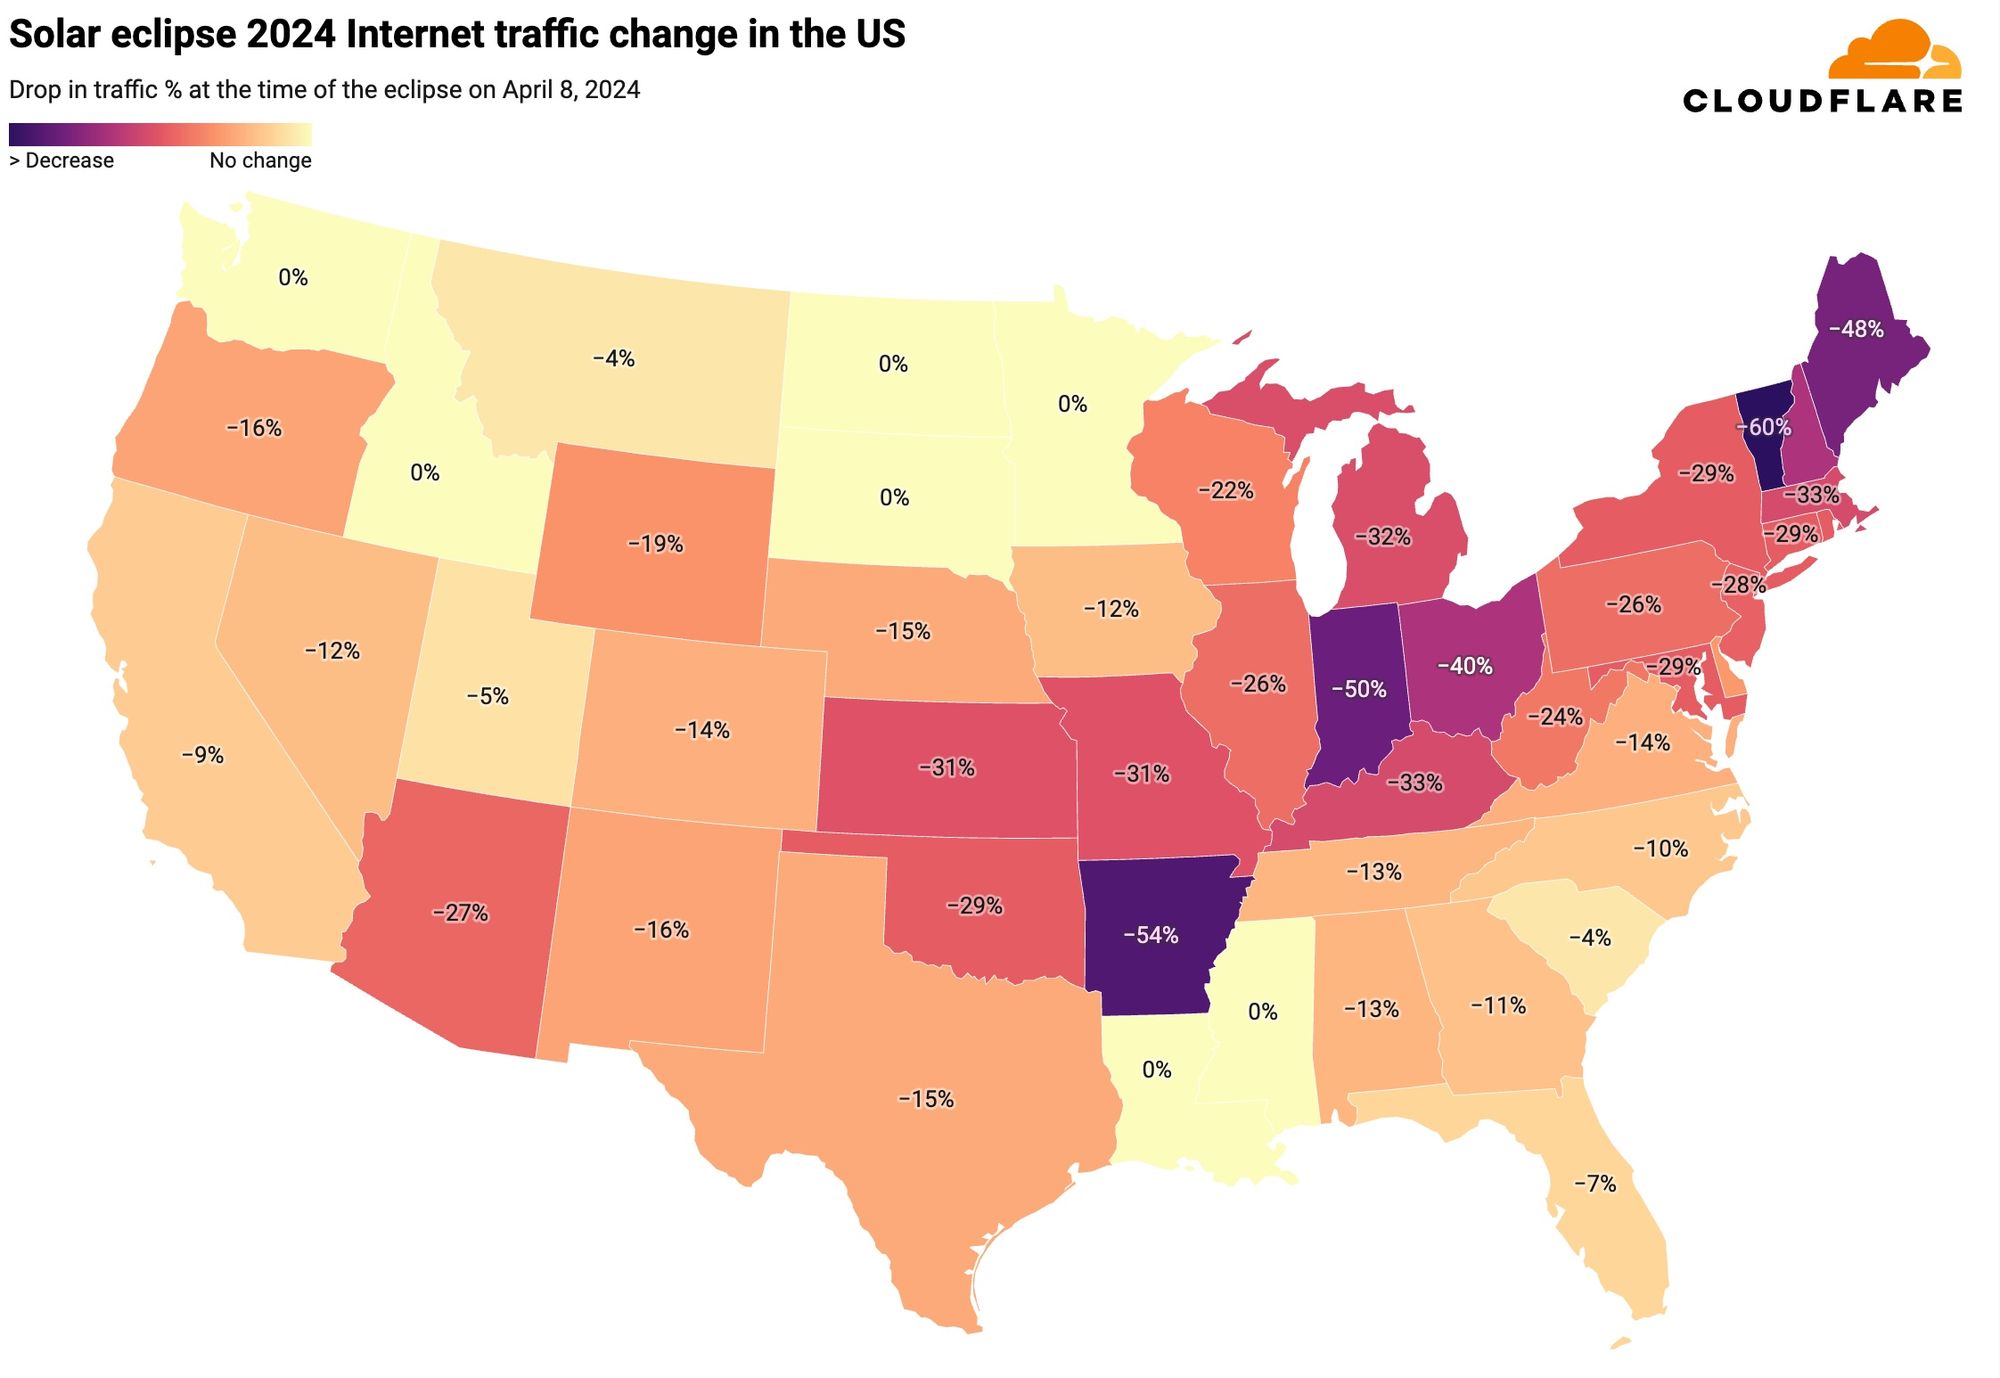
From our data, Vermont, Arkansas, Indiana, Maine, New Hampshire, and Ohio experienced traffic drops of 40% or more around the time of the eclipse. These states were all in the path of totality, which was not the case for several others.
In the next table, we provide a detailed breakdown of the same perspective shown on the US map ordered by drop in traffic. In all of these charts, we're using UTC as the time. We include the time of the biggest traffic drop compared to the previous week, at a 5-minute granularity, and also the percentage of drop compared to the previous week. States where it was possible to see at least part of the total eclipse are highlighted in bold. At the bottom are those with no clear difference.
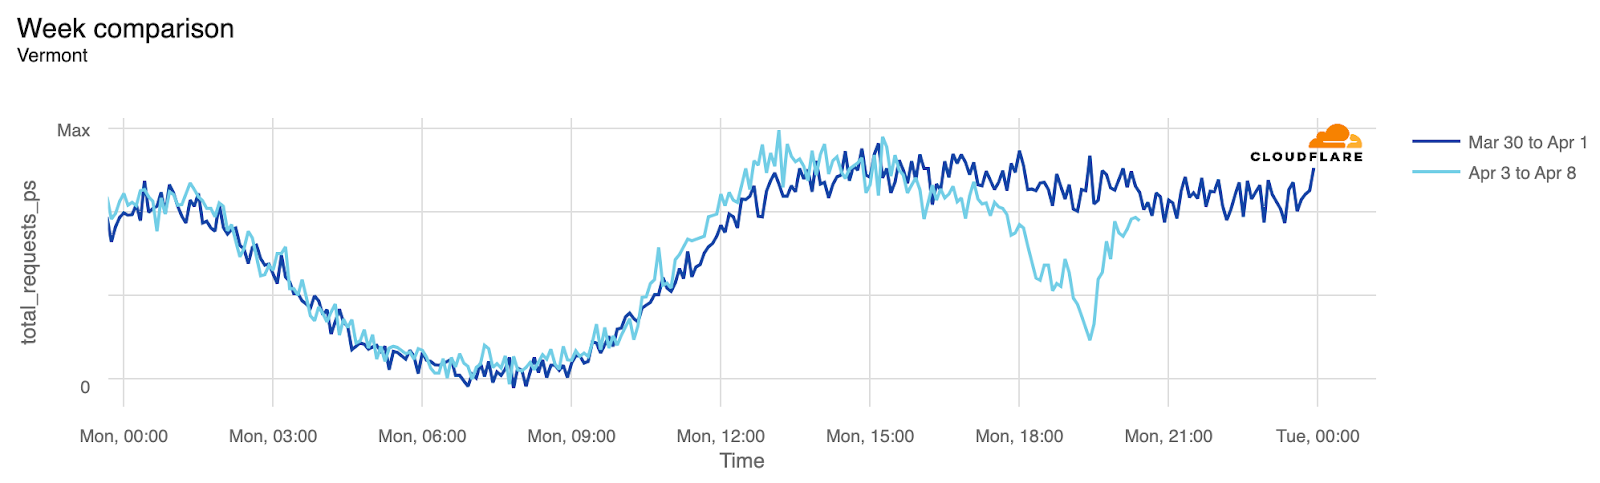
Visualized, here's what Vermont’s 60% drop looks like:
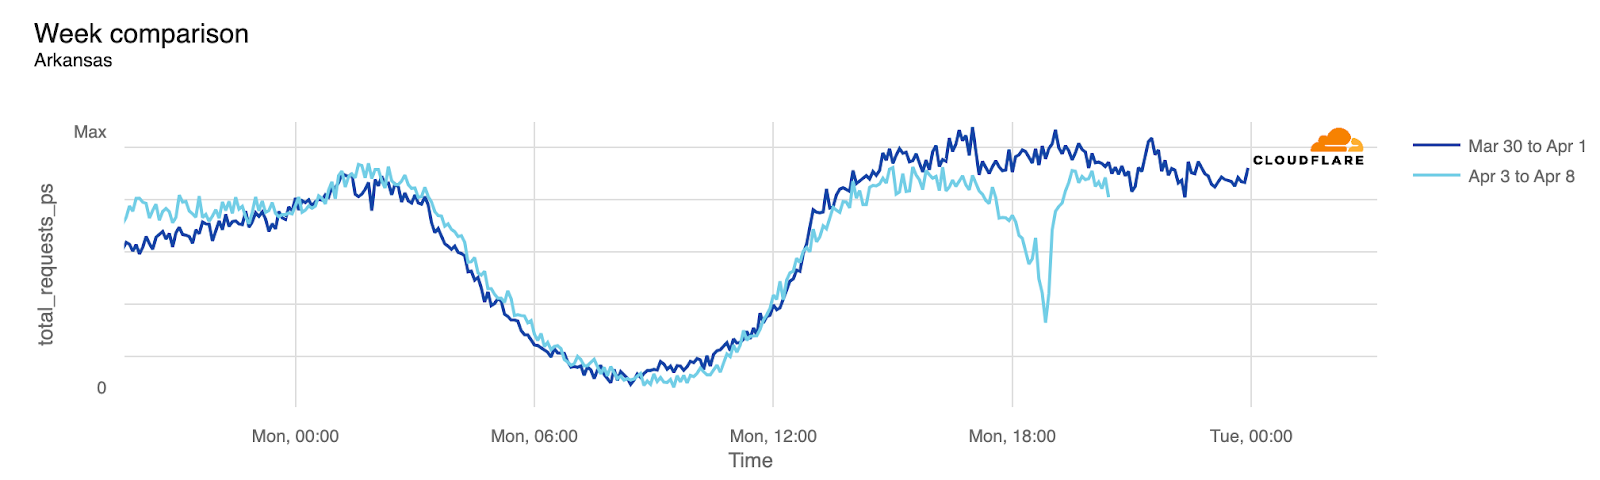
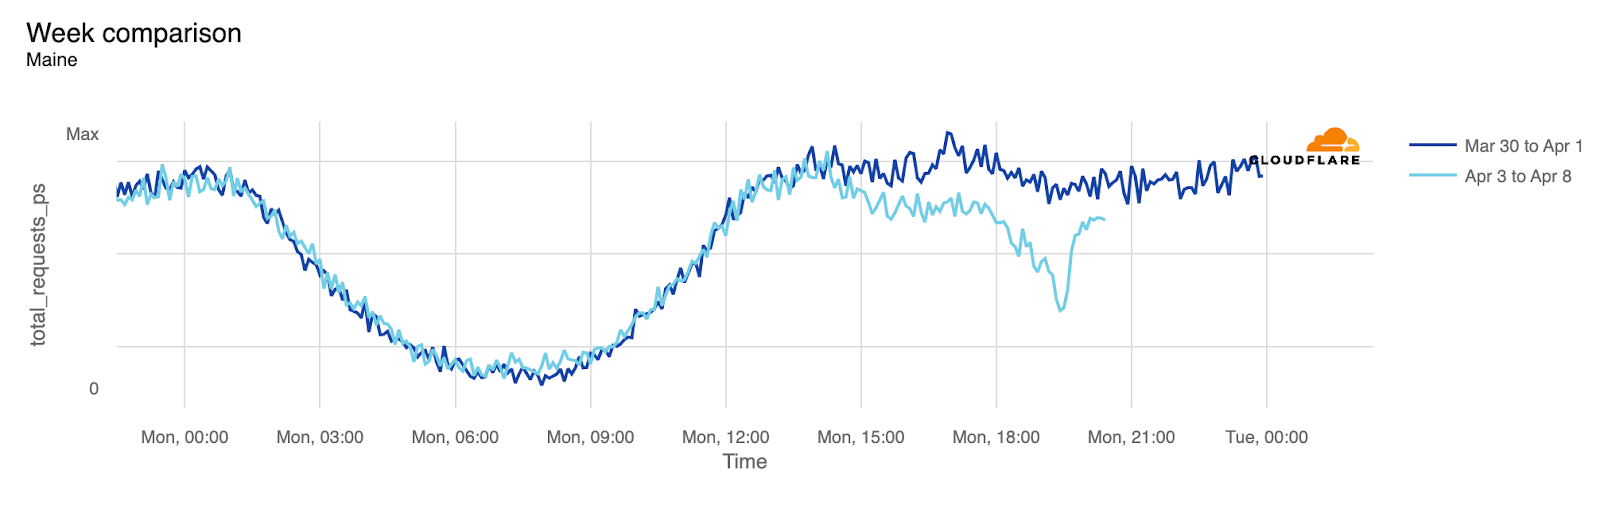
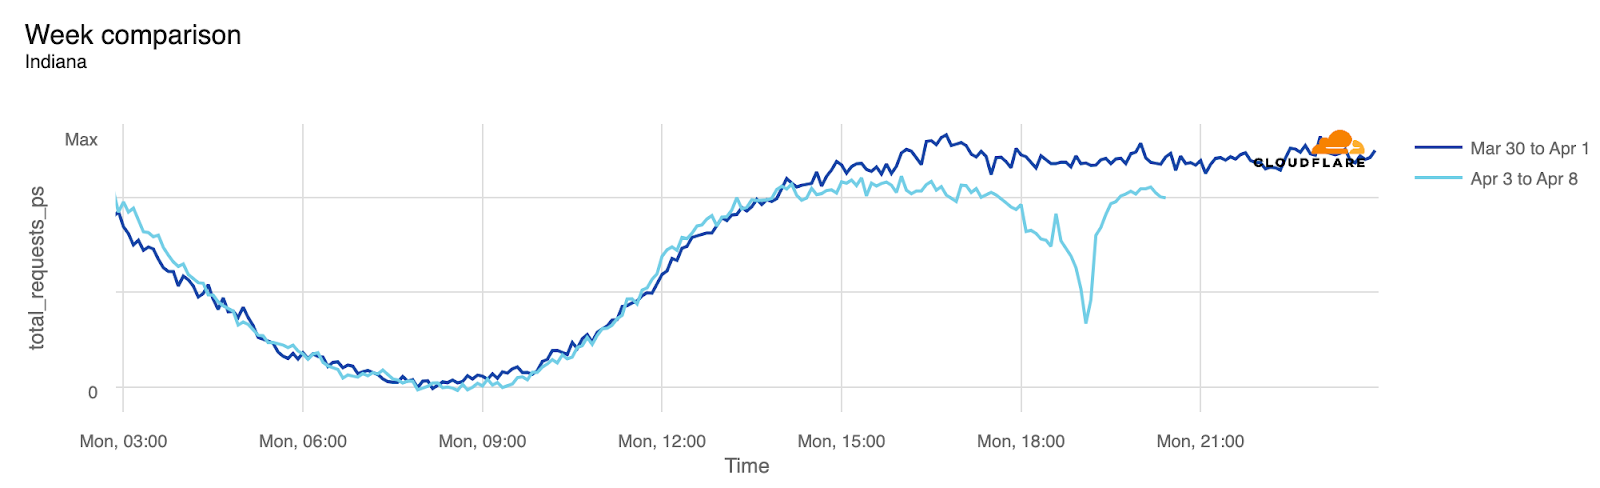
And here's what the traffic drops in Arkansas, Maine, and Indiana look like:
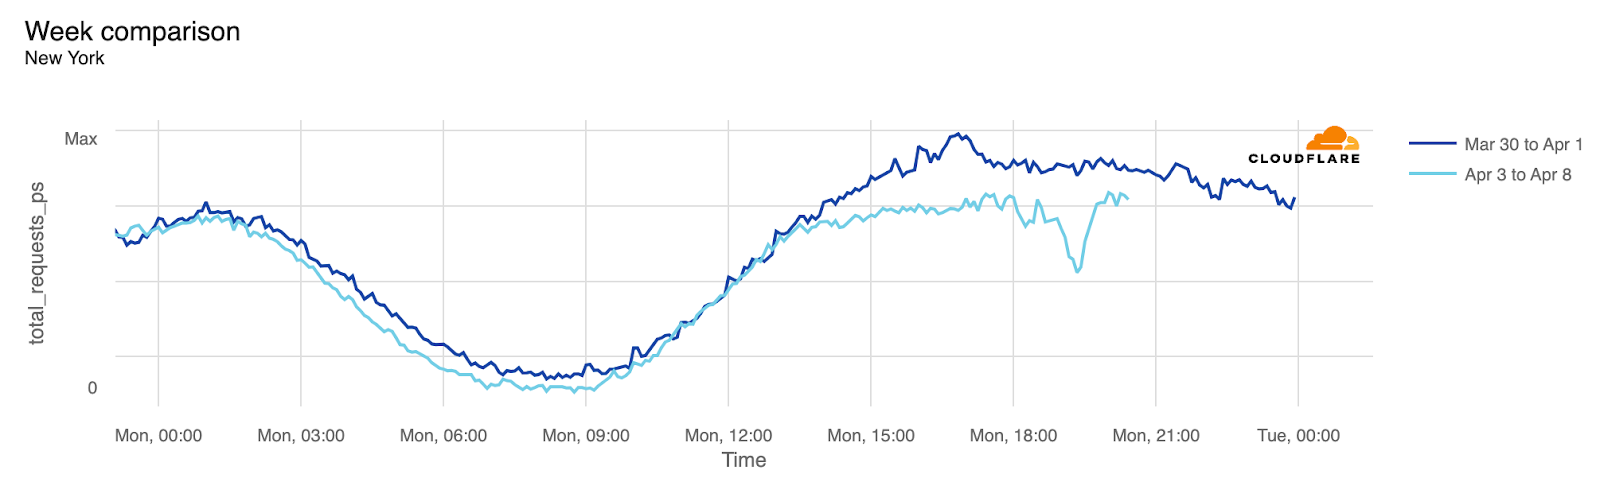
In terms of states with larger populations, New York took the lead:
Mexico got the eclipse first
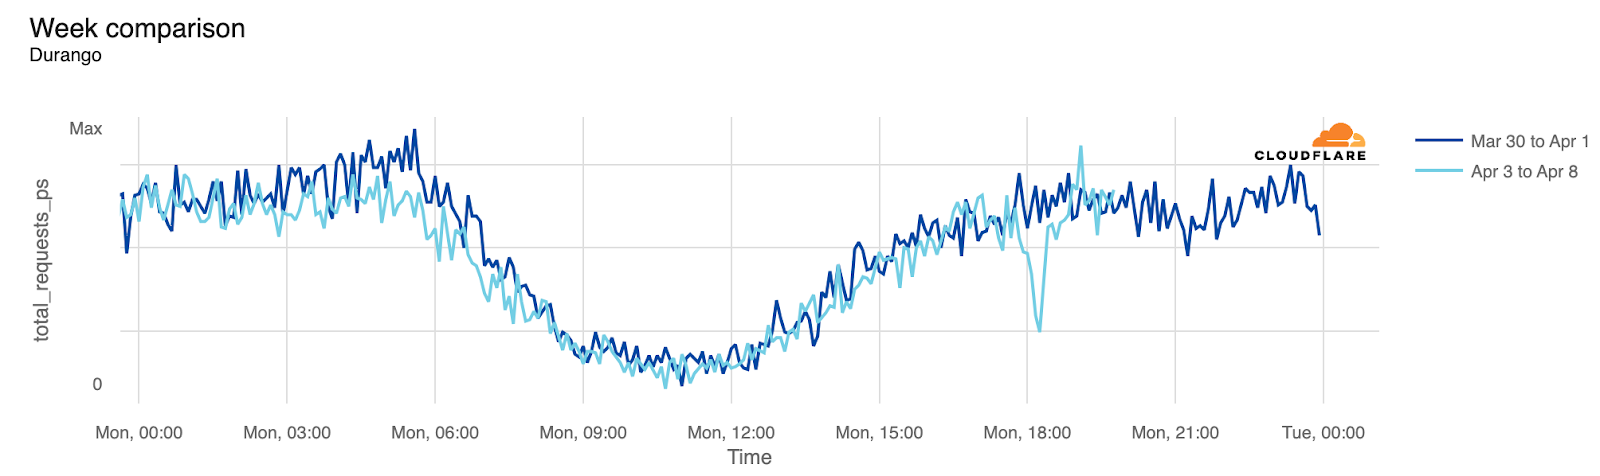
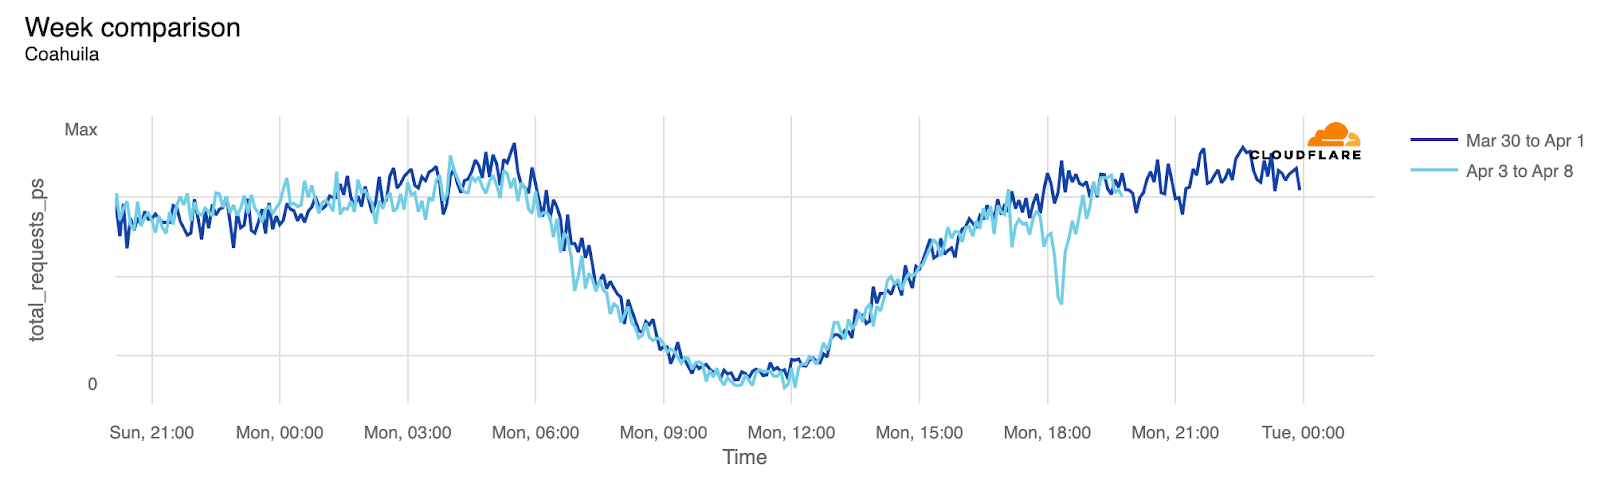
Before the eclipse became visible in the US, Mexico experienced it first. States within the eclipse zone, such as Coahuila, Durango, and Sinaloa, experienced noticeable drops in traffic. Even Mexico City, located further south, was affected.
Here’s the Durango and Coahuila state perspectives:
Canada at last: an island stopped to see the eclipse
After Mexico and the US, Canada was next in the path of the eclipse. Prince Edward Island experienced the most significant impact in Canada. This region, with a population of less than 200,000, is one of eastern Canada's maritime provinces, situated off New Brunswick and Nova Scotia in the Gulf of St. Lawrence. Next came New Brunswick and Newfoundland and Labrador.
Conclusion: Internet is a human’s game
As we've observed during previous occasions, human and nature-related events significantly impact Internet traffic. This includes Black Friday/Cyber Week, Easter, Ramadan celebrations, the coronation of King Charles III, the recent undersea cable failure in Africa, which affected 13 countries, and now, this total eclipse.
This was the last total solar eclipse visible in the contiguous United States until August 23, 2044, with the next eclipse of similar breadth projected for August 12, 2045.
For this and other trends, visit Cloudflare Radar and follow us on social media at @CloudflareRadar (X), cloudflare.social/@radar (Mastodon), and radar.cloudflare.com (Bluesky).