
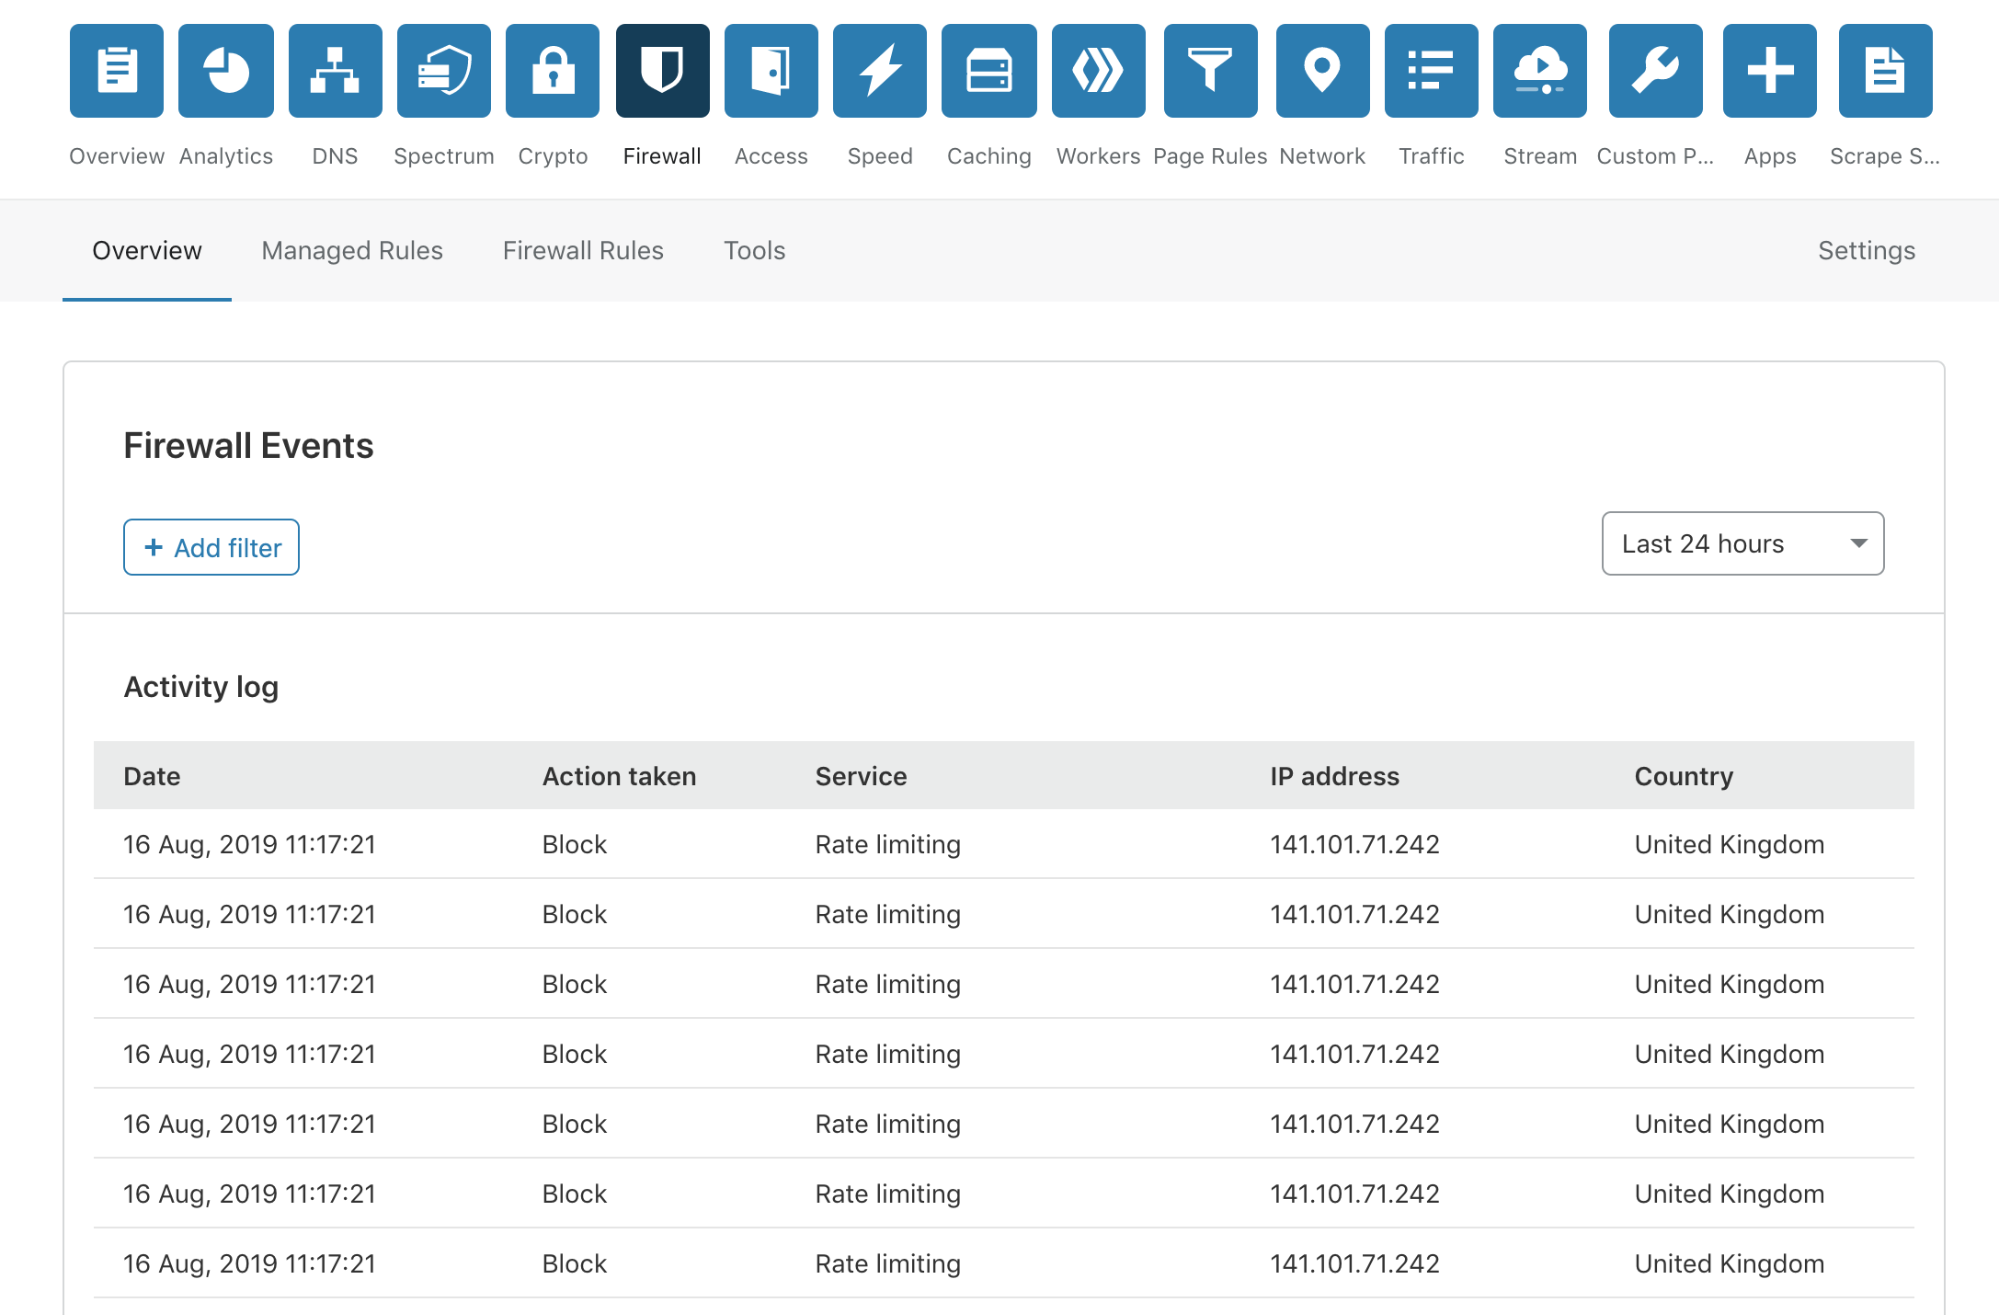
Today, I’m very pleased to announce the release of a completely overhauled version of our Firewall Event log to our Free, Pro and Business customers. This new Firewall Events log is now available in your Dashboard, and you are not required to do anything to receive this new capability.
No more modals!
We have done away with those pesky modals, providing a much smoother user experience. To review more detailed information about an event, you simply click anywhere on the event list row.
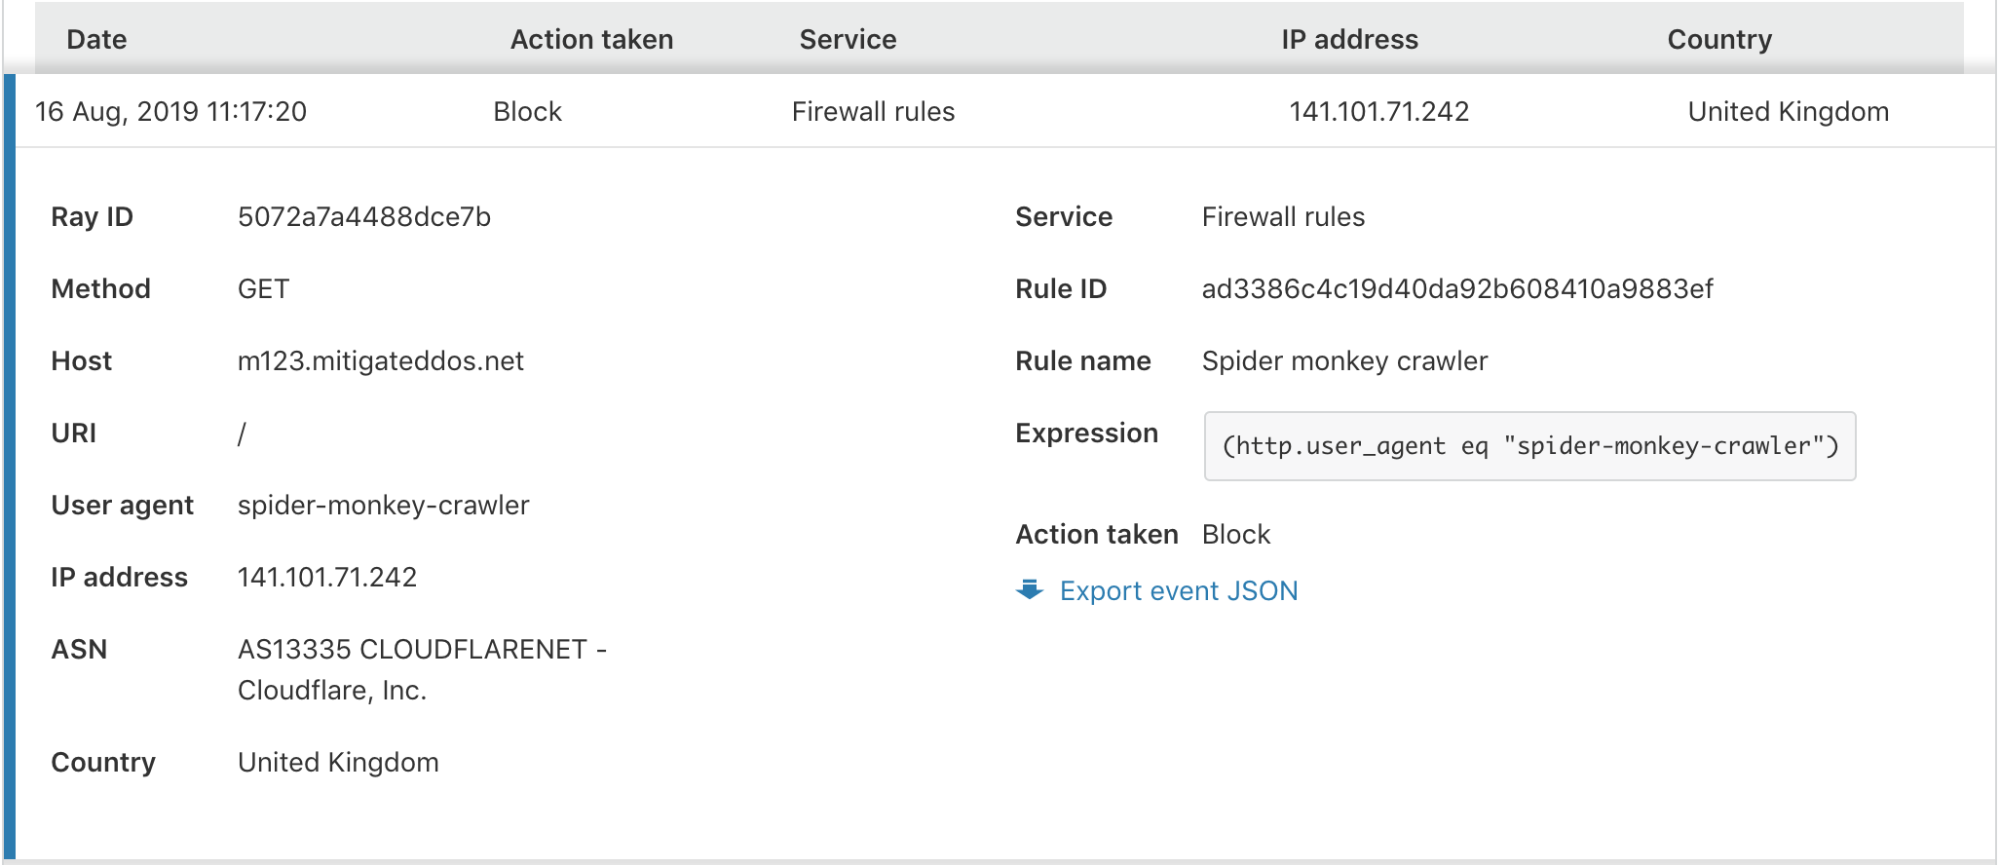
In the expanded view, you are provided with all the information you may need to identify or diagnose issues with your Firewall or find more details about a potential threat to your application.
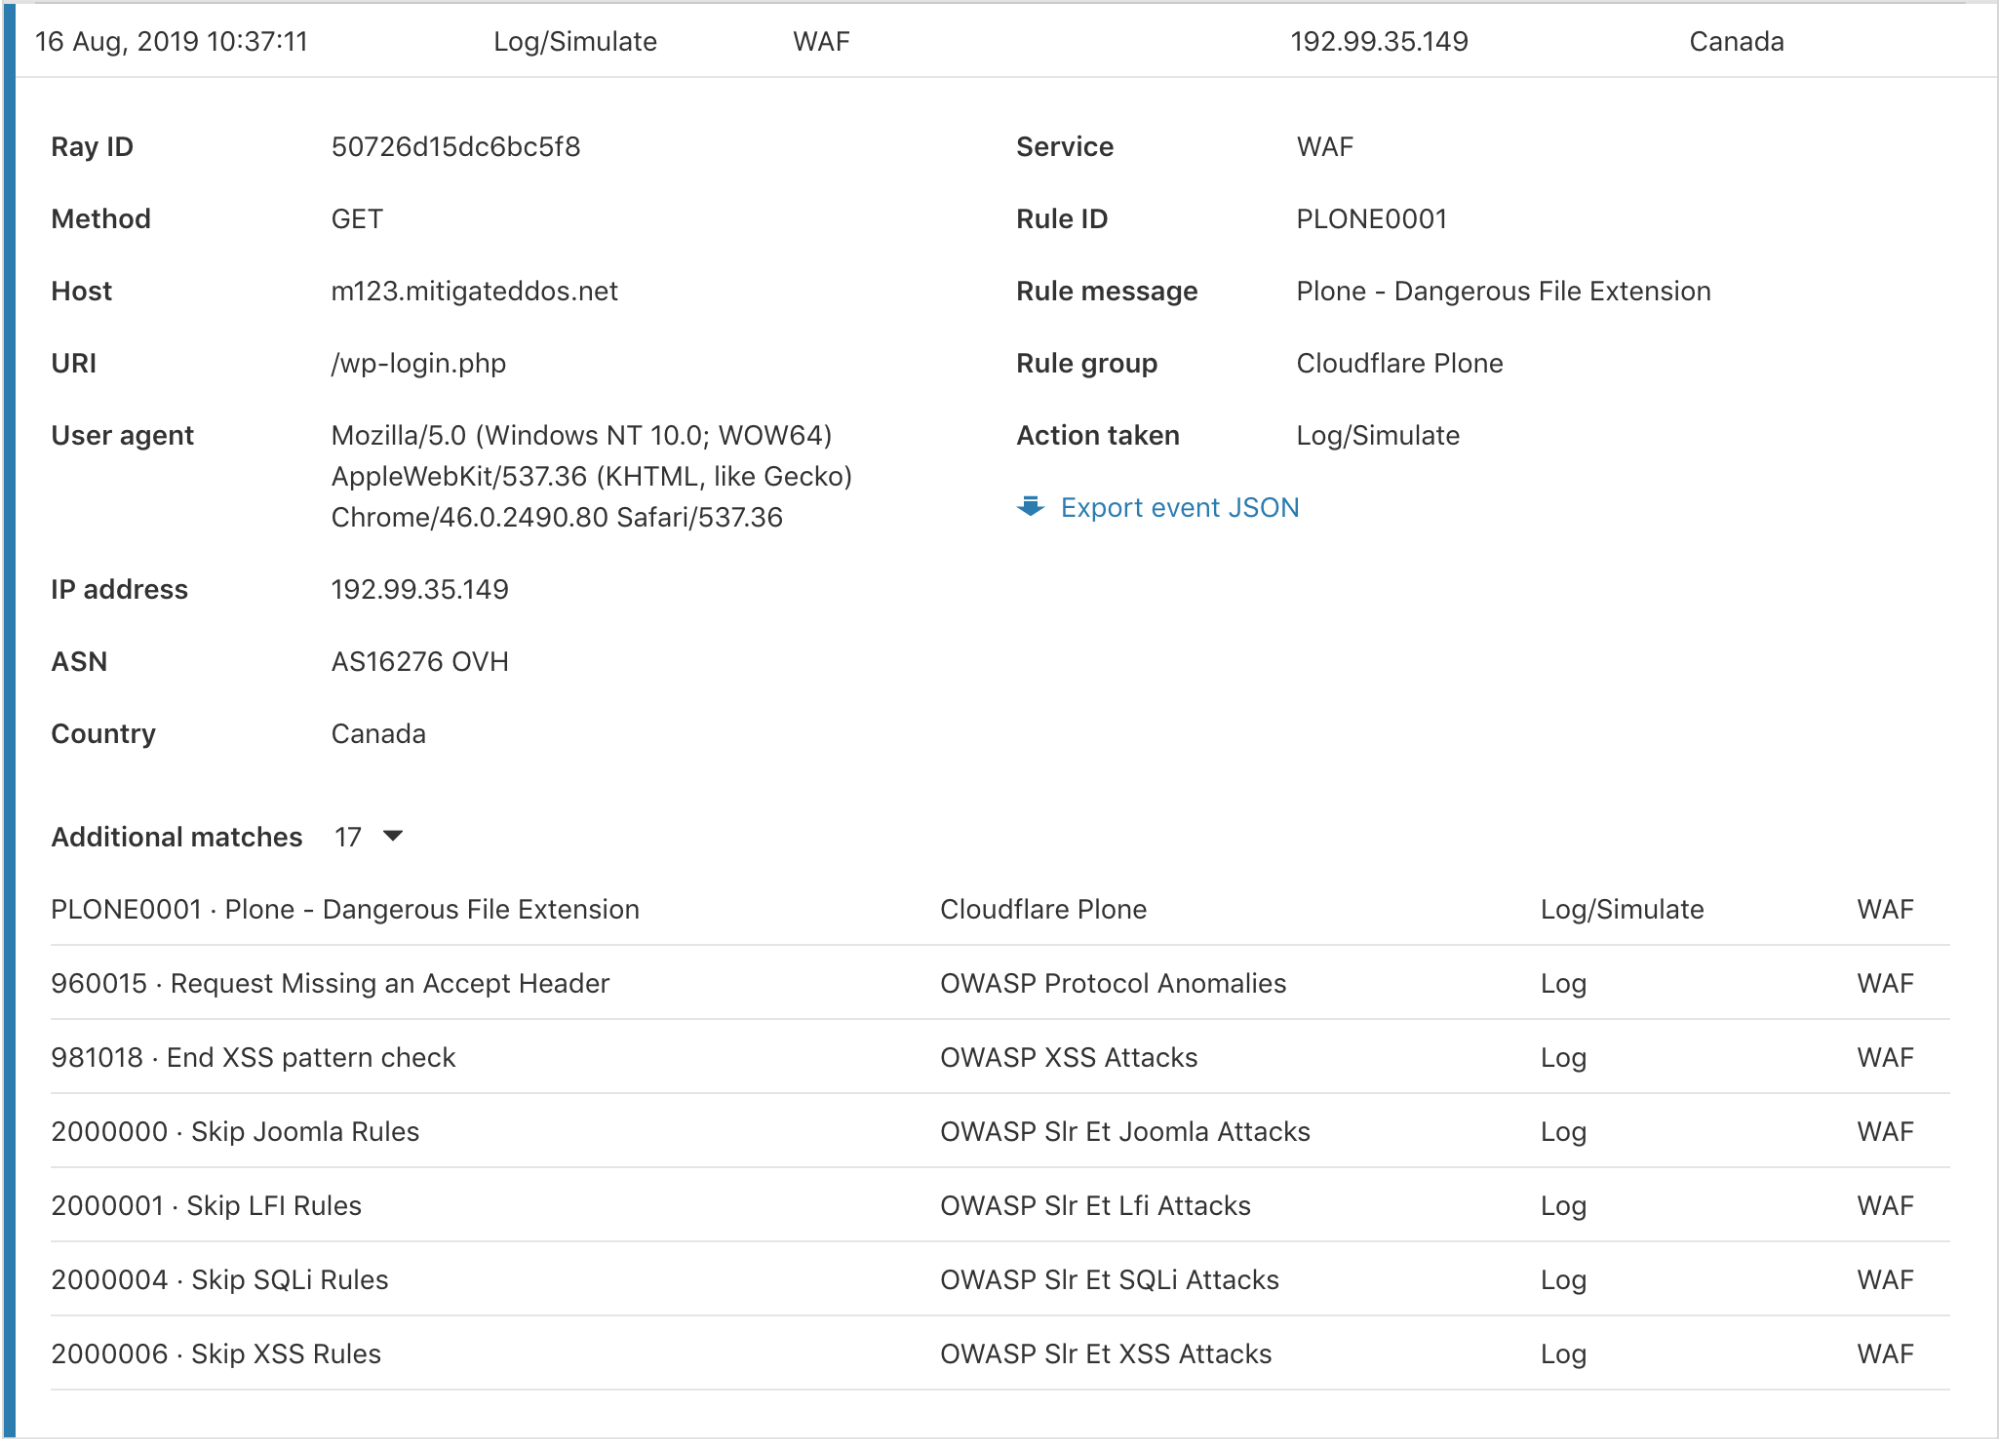
Additional matches per event
Cloudflare has several Firewall features to give customers granular control of their security. With this control comes some complexity when debugging why a request was stopped by the Firewall. To help clarify what happened, we have provided an “Additional matches” count at the bottom for events triggered by multiple services or rules for the same request. Clicking the number expands a list showing each rule and service along with the corresponding action.
Search for any field within a Firewall Event
This is one of my favourite parts of our new Firewall Event Log. Many of our customers have expressed their frustration with the difficulty of pinpointing specific events. This is where our new search capabilities come into their own. Customers can now filter and freeform search for any field that is visible in a Firewall Event!
Let’s say you want to find all the requests originating from a specific ISP or country where your Firewall Rules issued a JavaScript challenge. There are two different ways to do this in the UI.
Firstly, when in the detail view, you can create an include or exclude filter for that field value.
Secondly, you can create a freeform filter using the “+ Add Filter” button at the top, or edit one of the already filtered fields:
As illustrated above, with our WAF Managed Rules enabled in log only, we can see all the rules which would have triggered if this was a legitimate attack. This allows you to confirm that your configuration is working as expected.
Scoping your search to a specific date and time
In our old Firewall Event Log, to find an event, users had to traverse through many pages to find Events from a specific date. The last major change we have added is the capability to select a time window to view events between two points in time over the last 2 weeks. In the time selection window, Free and Pro customers can choose a 24 hour time window and our Business customers can view up to 72 hours.
We want your feedback!
We need your help! Please feel free to leave any feedback on our Community forums, or open a Support ticket with any problems you find. Your feedback is critical to our product improvement process, and we look forward to hearing from you.