
A month ago I wrote about changes in Internet traffic caused by the COVID-19 emergency. At the time I wrote:
Cloudflare is watching carefully as Internet traffic patterns around the world alter as people alter their daily lives through home-working, cordon sanitaire, and social distancing. None of these traffic changes raise any concern for us. Cloudflare's network is well provisioned to handle significant spikes in traffic. We have not seen, and do not anticipate, any impact on our network's performance, reliability, or security globally.
That holds true today; our network is performing as expected under increased load. Overall the Internet has shown that it was built for this: designed to handle huge changes in traffic, outages, and a changing mix of use. As we are well into April I thought it was time for an update.
Growth
Here's a chart showing the relative change in Internet use as seen by Cloudflare since the beginning of the year. I've calculated moving average of the trailing seven days for each country and use December 29, 2019 as the reference point.
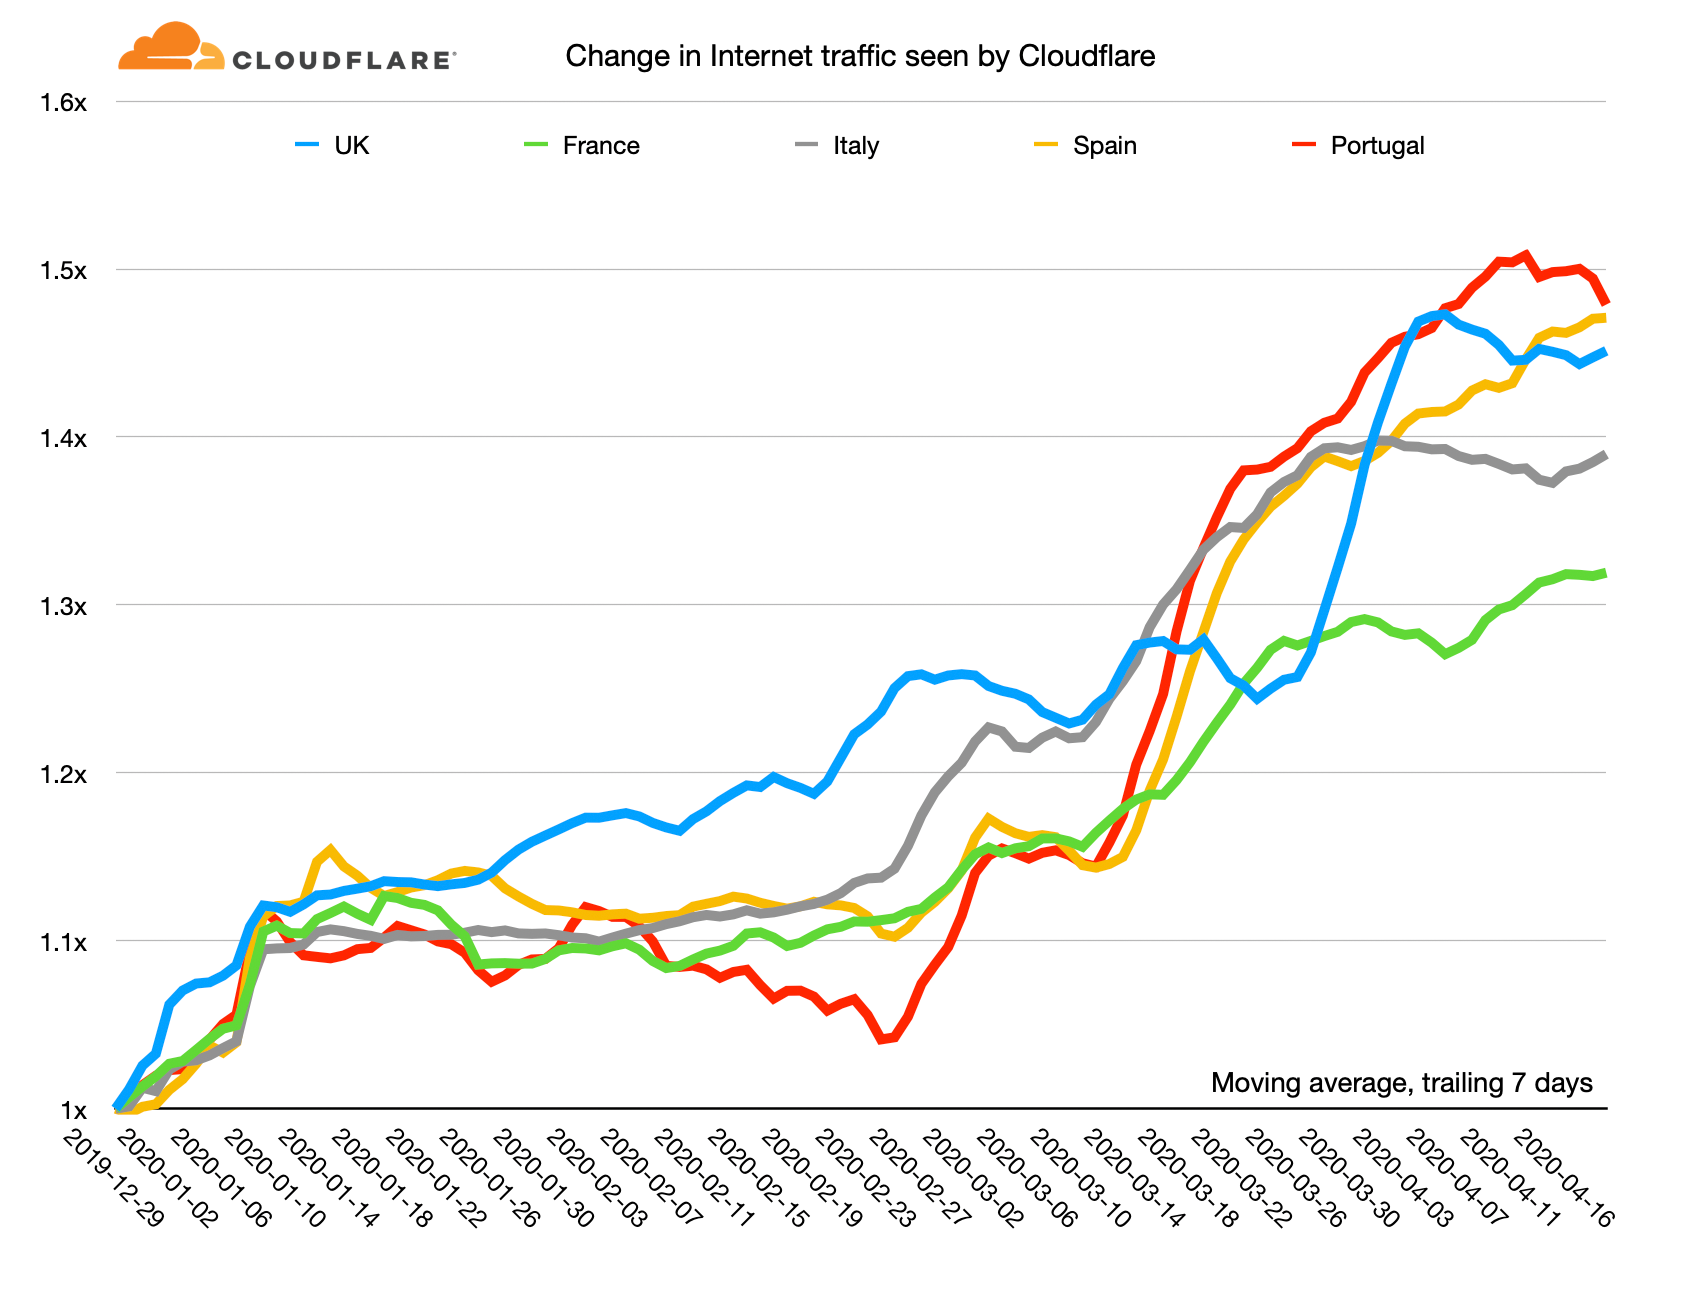
On this chart the highest growth in Internet use has been in Portugal: it's currently running at about a 50% increase with Spain close behind followed by the UK. Italy flattened out at about a 40% increase in usage towards the end of March and France seems to be plateauing at a little over 30% up on the end of last year.
It's interesting to see how steeply Internet use grew in the UK, Spain and Portugal (the red, yellow and blue lines rise very steeply), with Spain and Portugal almost in unison and the UK lagging by about two weeks.
Looking at some other major economies we see other, yet similar patterns.
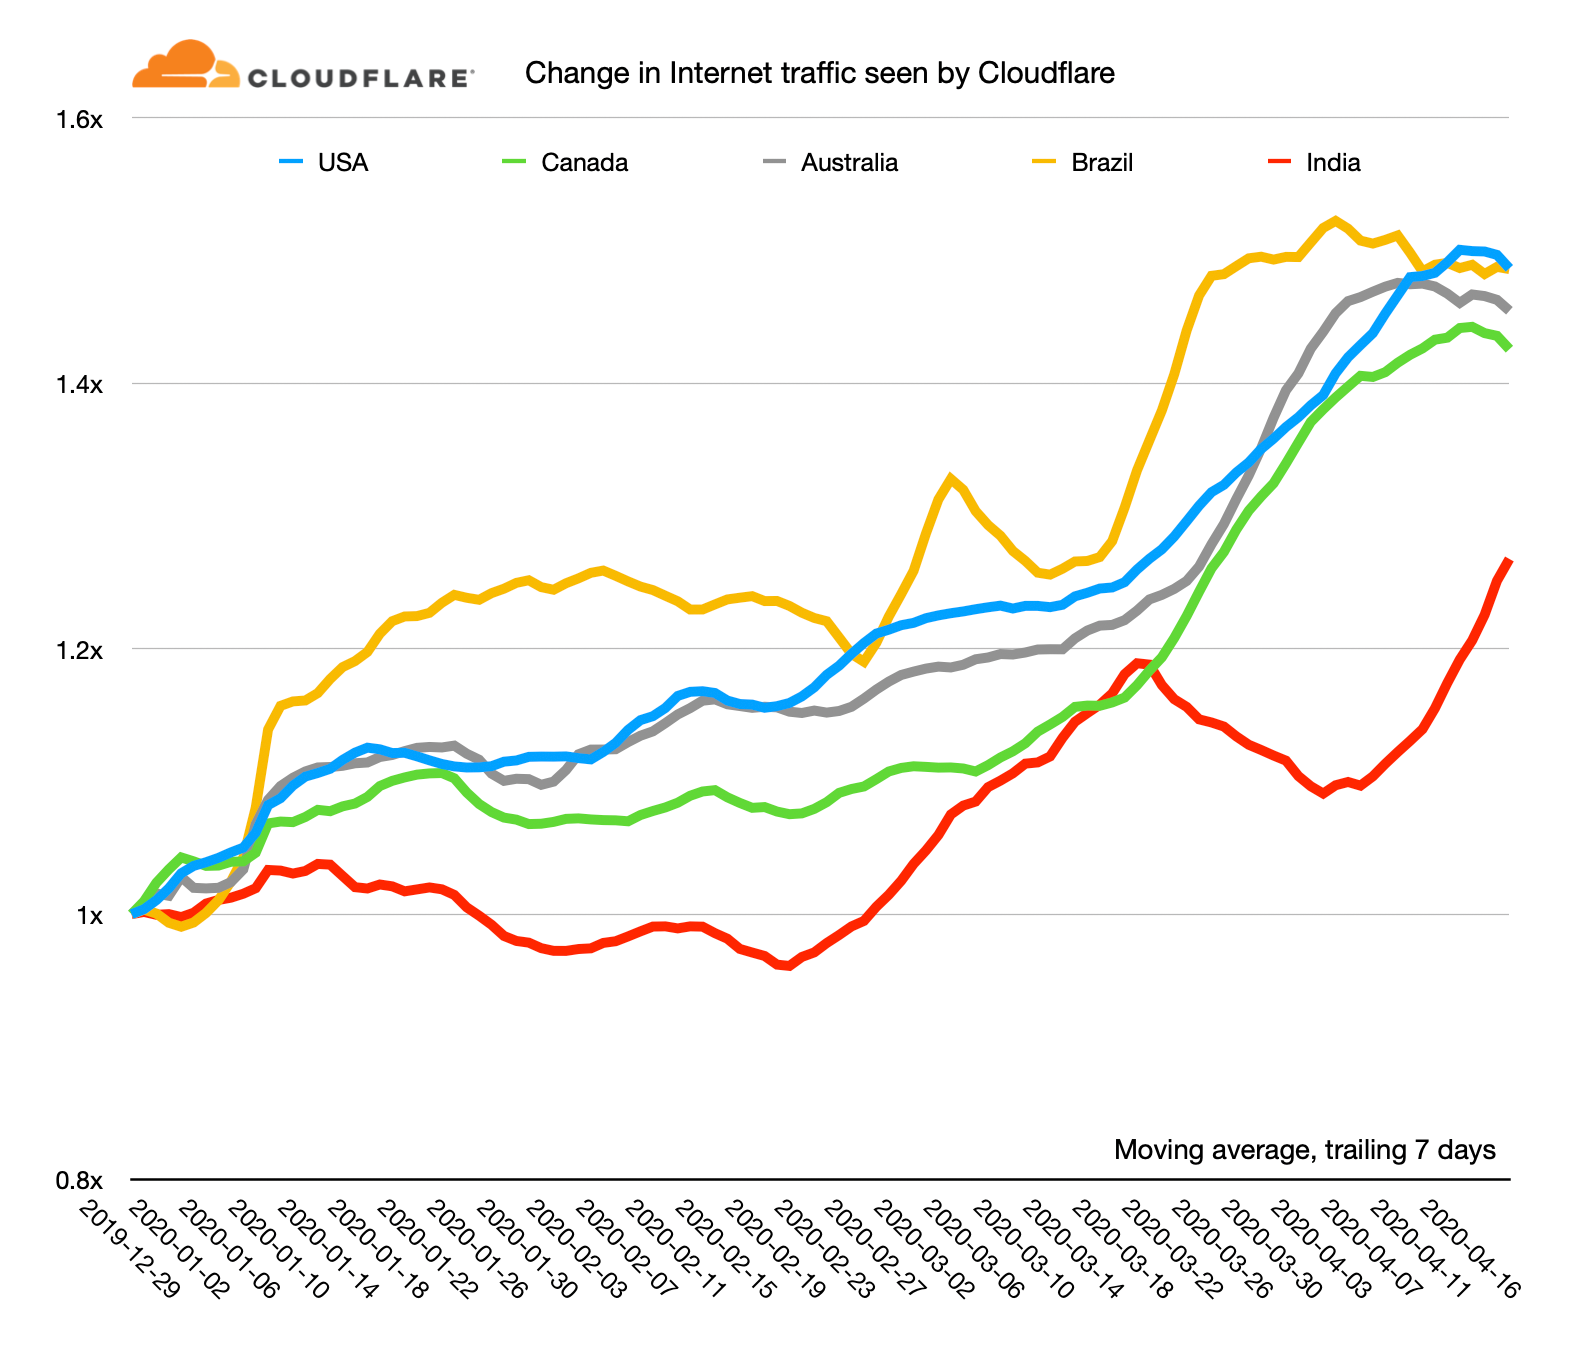
Similar increases in utilization are seen here. The US, Canada, Australia and Brazil are all running at between 40% and 50% the level of use at the beginning of the year.
Stability
We measure the TCP RTT (round trip time) between our servers and visitors to Internet properties that are Cloudflare customers. This gives us a measure of the speed of the networks between us and end users, and if the RTT increases it is also a measure of congestion along the path.
Looking at TCP RTT over the last 90 days can help identify changes in congestion or the network. Cloudflare connects widely to the Internet via peering (and through the use of transit) and we connect to the largest number of Internet exchanges worldwide to ensure fast access for all users.
Cloudflare is also present in 200 cities worldwide; thus the TCP RTT seen by Cloudflare gives a measure of the performance of end-user networks within a country. Here's a chart showing the median and 95th percentile TCP RTT in the UK in the last 90 days.
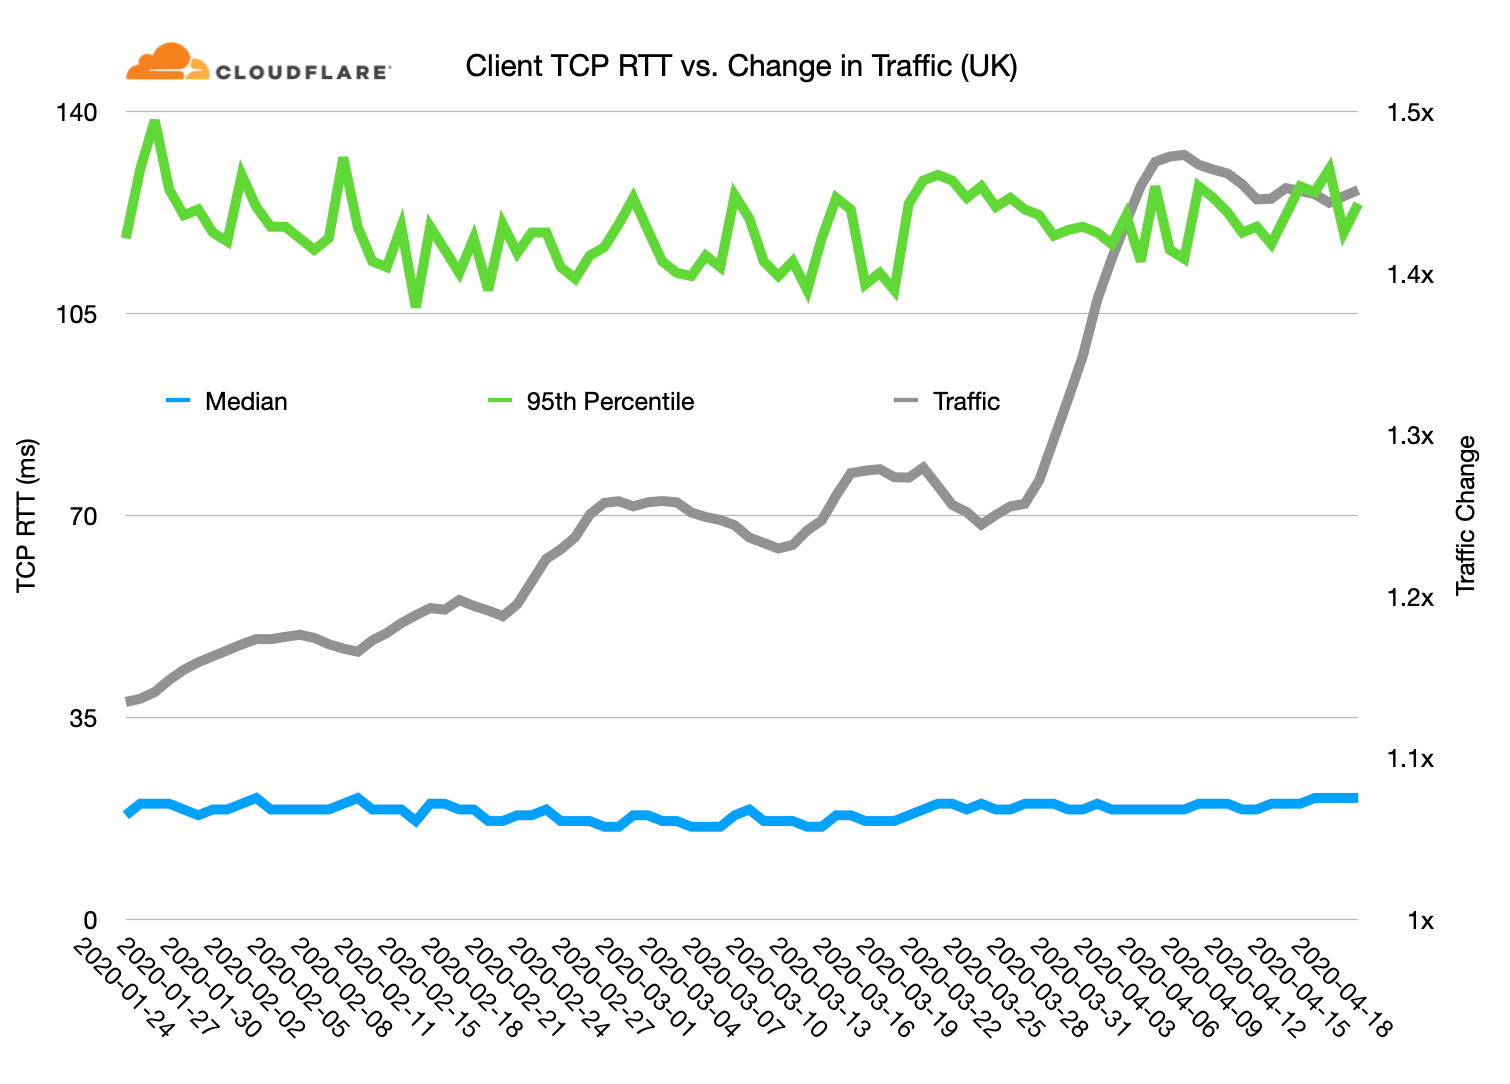
What's striking in this chart is that despite the massive increase in Internet use (the grey line), the TCP RTT hasn't changed significantly. From our vantage point UK networks are coping well.
Here's the situation in Italy:
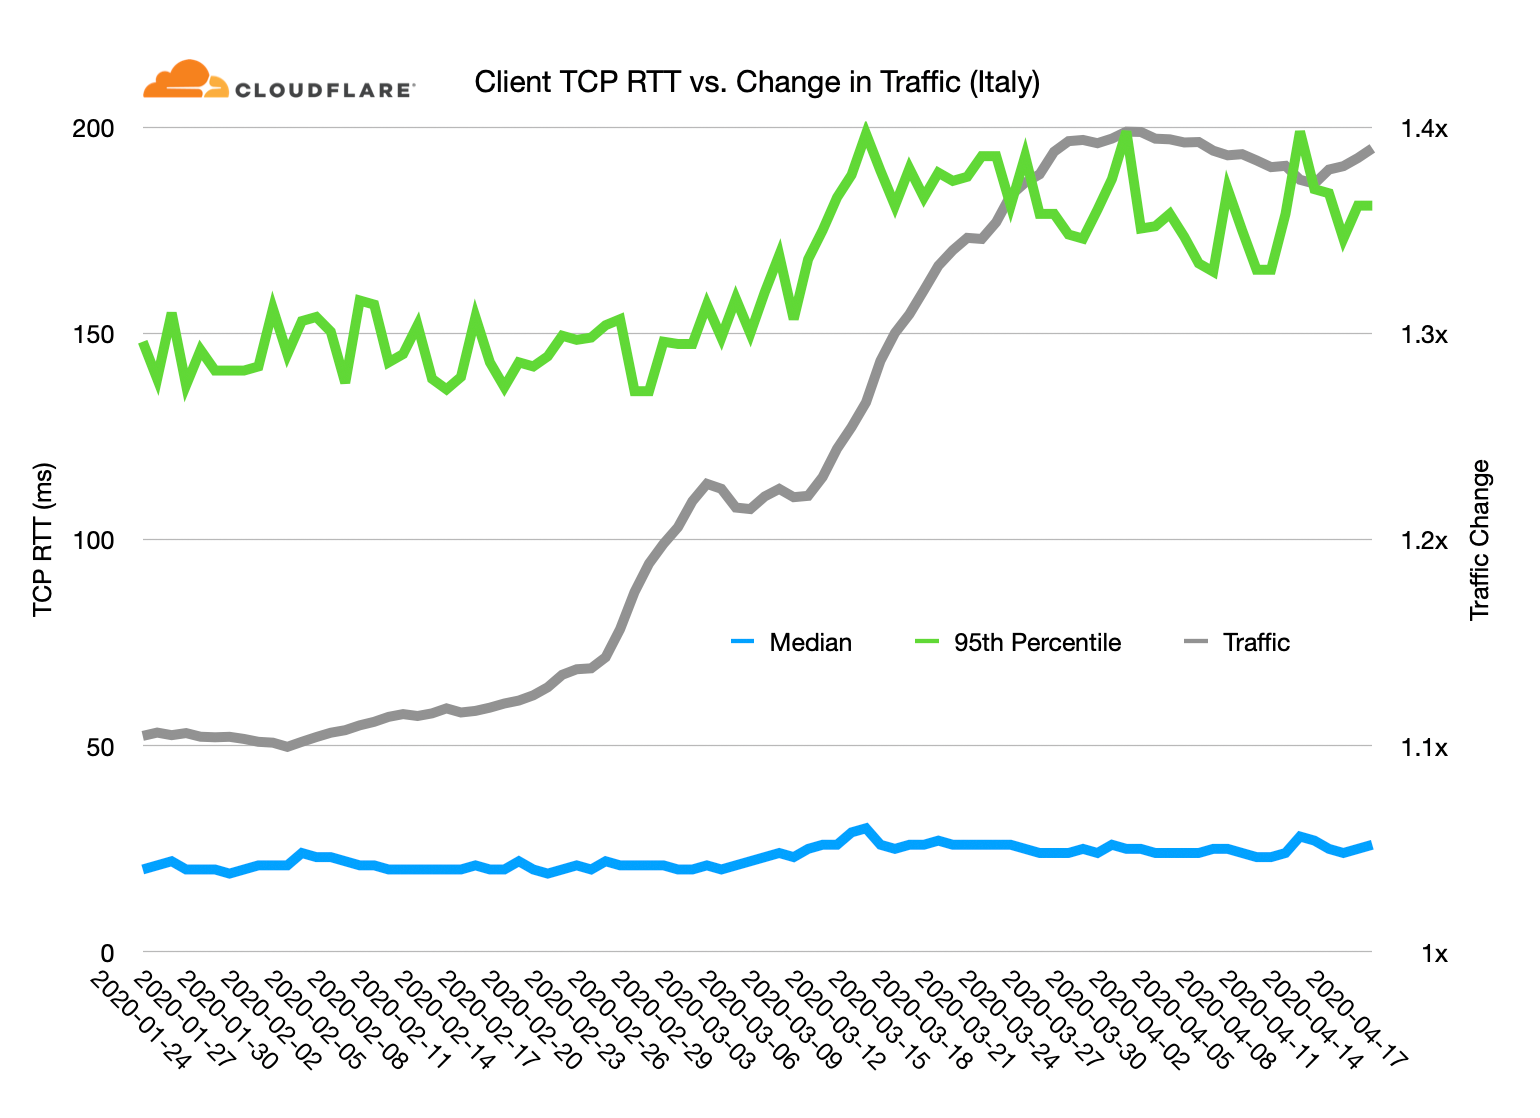
The picture here is slightly different. Both median and 95th percentile TCP RTT increased as traffic increased. This indicates that networks aren't operating as smoothly in Italy. It's noticeable, though, that as traffic has plateaued the TCP RTT has improved somewhat (take a look at the 95th percentile) indicating that ISPs and other network providers in Italy have likely taken action to improve the situation.
This doesn't mean that Italian Internet is in trouble, just that it's strained more than, say, the Internet in the UK.
Conclusion
The Internet has seen incredible, sudden growth in traffic but continues to operate well. What Cloudflare sees reflects what we've heard anecdotally: some end-user networks are feeling the strain of the sudden change of load but are working and helping us all cope with the societal effects of COVID-19.
It's hard to imagine another utility (say electricity, water or gas) coping with a sudden and continuous increase in demand of 50%.