Congratulations on making it through Speed Week. In the last week, Cloudflare has: described how our global network speeds up the Internet, launched a HTTP/2 prioritisation model that will improve web experiences on all browsers, launched an image resizing service which will deliver the optimal image to every device, optimized live video delivery, detailed how to stream progressive images so that they render twice as fast - using the flexibility of our new HTTP/2 prioritisation model and finally, prototyped a new over-the-wire format for JavaScript that could improve application start-up performance especially on mobile devices. As a bonus, we’re also rolling out one more new feature: “TCP Turbo” automatically chooses the TCP settings to further accelerate your website.
As a company, we want to help every one of our customers improve web experiences. The growth of Cloudflare, along with the increase in features, has often made simple questions difficult to answer:
- How fast is my website?
- How should I be thinking about performance features?
- How much faster would the site be if I were to enable a particular feature?
This post will describe the exciting changes we have made to the Speed Page on the Cloudflare dashboard to give our customers a much clearer understanding of how their websites are performing and how they can be made even faster. The new Speed Page consists of :
- A visual comparison of your website loading on Cloudflare, with caching enabled, compared to connecting directly to the origin.
- The measured improvement expected if any performance feature is enabled.
- A report describing how fast your website is on desktop and mobile.
We want to simplify the complexity of making web experiences fast and give our customers control. Take a look - We hope you like it.
Why do fast web experiences matter?
Customer experience : No one likes slow service. Imagine if you go to a restaurant and the service is slow, especially when you arrive; you are not likely to go back or recommend it to your friends. It turns out the web works in the same way and Internet customers are even more demanding. As many as 79% of customers who are “dissatisfied” with a website’s performance are less likely to buy from that site again.
Engagement and Revenue : There are many studies explaining how speed affects customer engagement, bounce rates and revenue.
Reputation : There is also brand reputation to consider as customers associate an online experience to the brand. A study found that for 66% of the sample website performance influences their impression of the company.
Diversity : Mobile traffic has grown to be larger than its desktop counterpart over the last few years. Mobile customers' expectations have become increasingly demanding and expect seamless Internet access regardless of location.
Mobile provides a new set of challenges that includes the diversity of device specifications. When testing, be aware that the average mobile device is significantly less capable than the top-of-the-range models. For example, there can be orders-of-magnitude disparity in the time different mobile devices take to run JavaScript. Another challenge is the variance in mobile performance, as customers move from a strong, high quality office network to mobile networks of different speeds (3G/5G), and quality within the same browsing session.
New Speed Page
There is compelling evidence that a faster web experience is important for anyone online. Most of the major studies involve the largest tech companies, who have whole teams dedicated to measuring and improving web experiences for their own services. At Cloudflare we are on a mission to help build a better and faster Internet for everyone - not just the selected few.
Delivering fast web experiences is not a simple matter. That much is clear.
To know what to send and when requires a deep understanding of every layer of the stack, from TCP tuning, protocol level prioritisation, content delivery formats through to the intricate mechanics of browser rendering. You will also need a global network that strives to be within 10 ms of every Internet user. The intrinsic value of such a network, should be clear to everyone. Cloudflare has this network, but it also offers many additional performance features.
With the Speed Page redesign, we are emphasizing the performance benefits of using Cloudflare and the additional improvements possible from our features.
The de facto standard for measuring website performance has been WebPageTest. Having its creator in-house at Cloudflare encouraged us to use it as the basis for website performance measurement. So, what is the easiest way to understand how a web page loads? A list of statistics do not paint a full picture of actual user experience. One of the cool features of WebPageTest is that it can generate a filmstrip of screen snapshots taken during a web page load, enabling us to quantify how a page loads, visually. This view makes it significantly easier to determine how long the page is blank for, and how long it takes for the most important content to render. Being able to look at the results in this way, provides the ability to empathise with the user.
How fast on Cloudflare ?
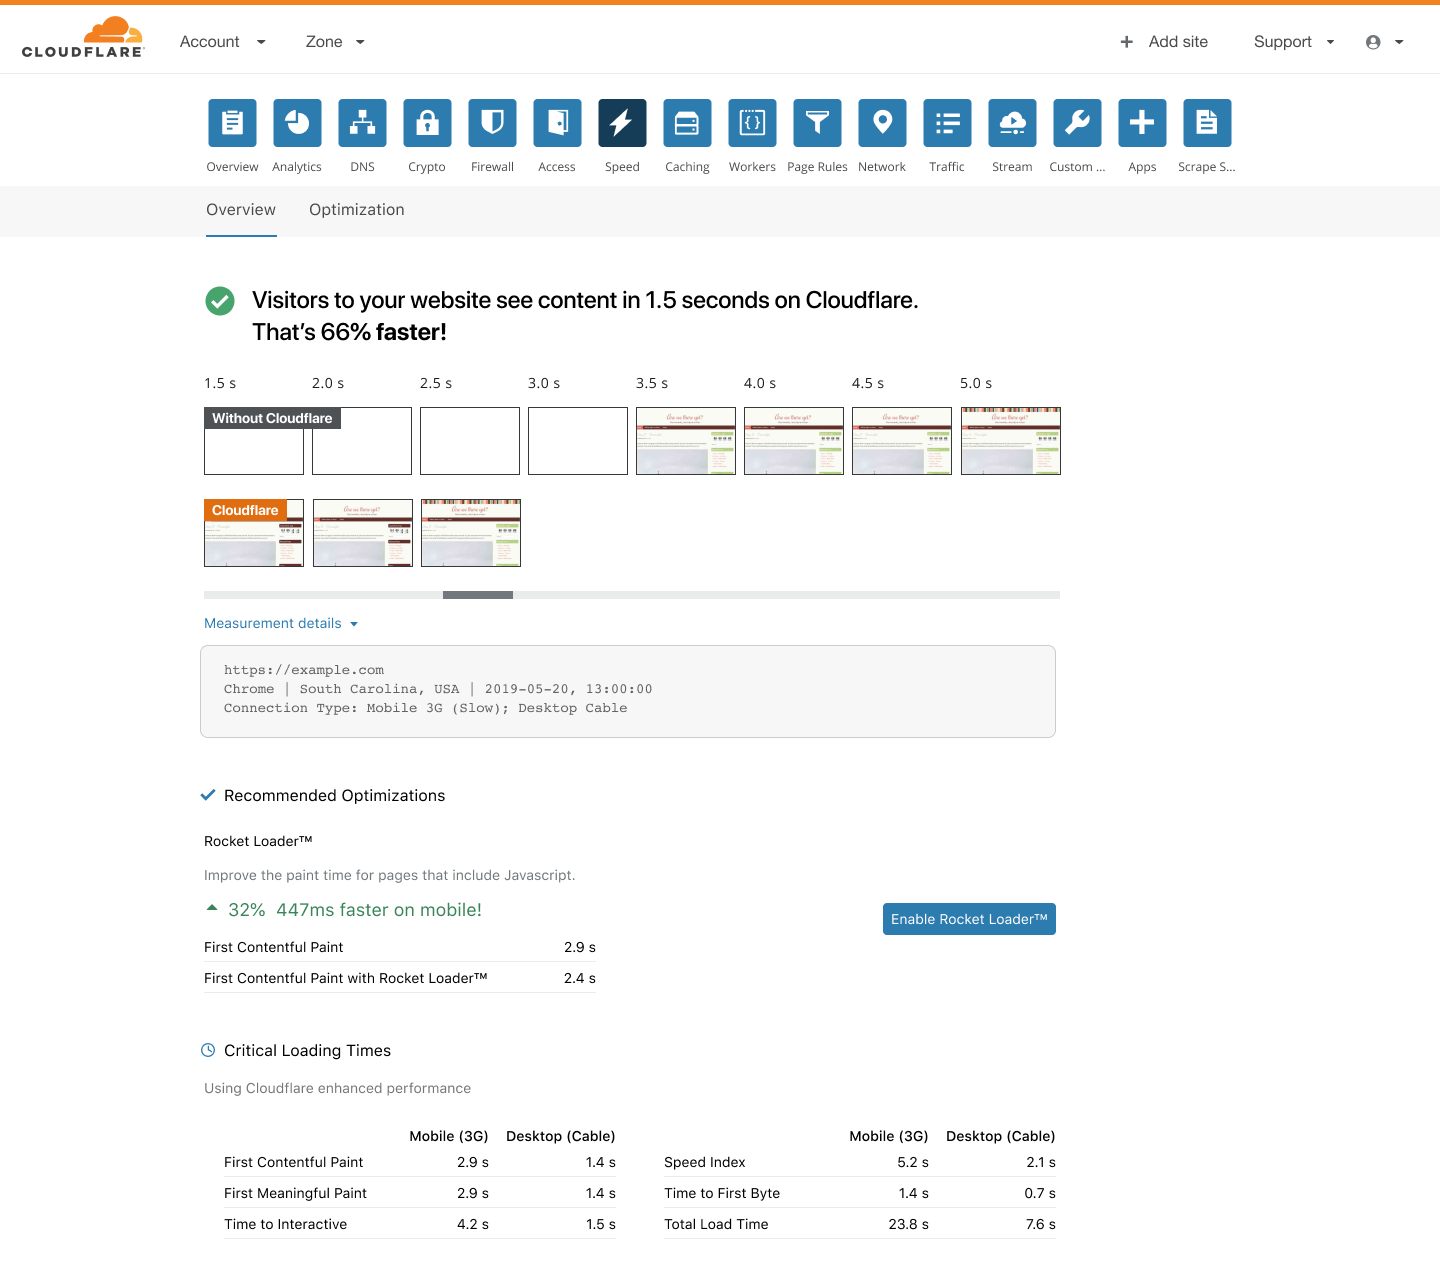
After moving your website to Cloudflare, you may have asked: How fast did this decision make my website? Well, now we provide the answer:
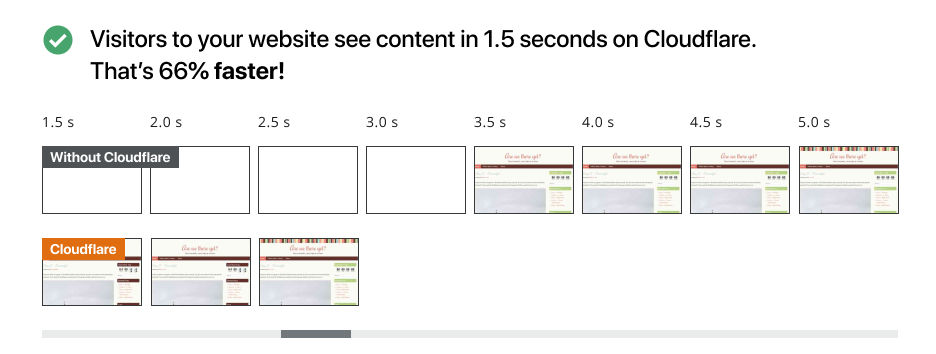
As well as the increase in speed, we provide filmstrips of before and after, so that it is easy to compare and understand how differently a user will experience the website. If our tests are unable to reach your origin and you are already setup on Cloudflare, we will test with development mode enabled, which disables caching and minification.
Site performance statistics
How can we measure the user experience of a website?
Traditionally, page load was the important metric. Page load is a technical measurement used by browser vendors that has no bearing on the presentation or usability of a page. The metric reports on how long it takes not only to load the important content but also all of the 3rd party content (social network widgets, advertising, tracking scripts etc.). A user may very well not see anything until after all the page content has loaded, or they may be able to interact with a page immediately, while content continues to load.
A user will not decide whether a page is fast by a single measure or moment. A user will perceive how fast a website is from a combination of factors:
- when they see any response
- when they see the content they expect
- when they can interact with the page
- when they can perform the task they intended
Experience has shown that if you focus on one measure, it will likely be to the detriment of the others.
Importance of Visual response
If an impatient user navigates to your site and sees no content for several seconds or no valuable content, they are likely to get frustrated and leave. The paint timing spec defines a set of paint metrics, when content appears on a page, to measure the key moments in how a user perceives performance.
First Contentful Paint (FCP) is the time when the browser first renders any DOM content.
First Meaningful Paint (FMP) is the point in time when the page’s “primary” content appears on the screen. This metric should relate to what the user has come to the site to see and is designed as the point in time when the largest visible layout change happens.
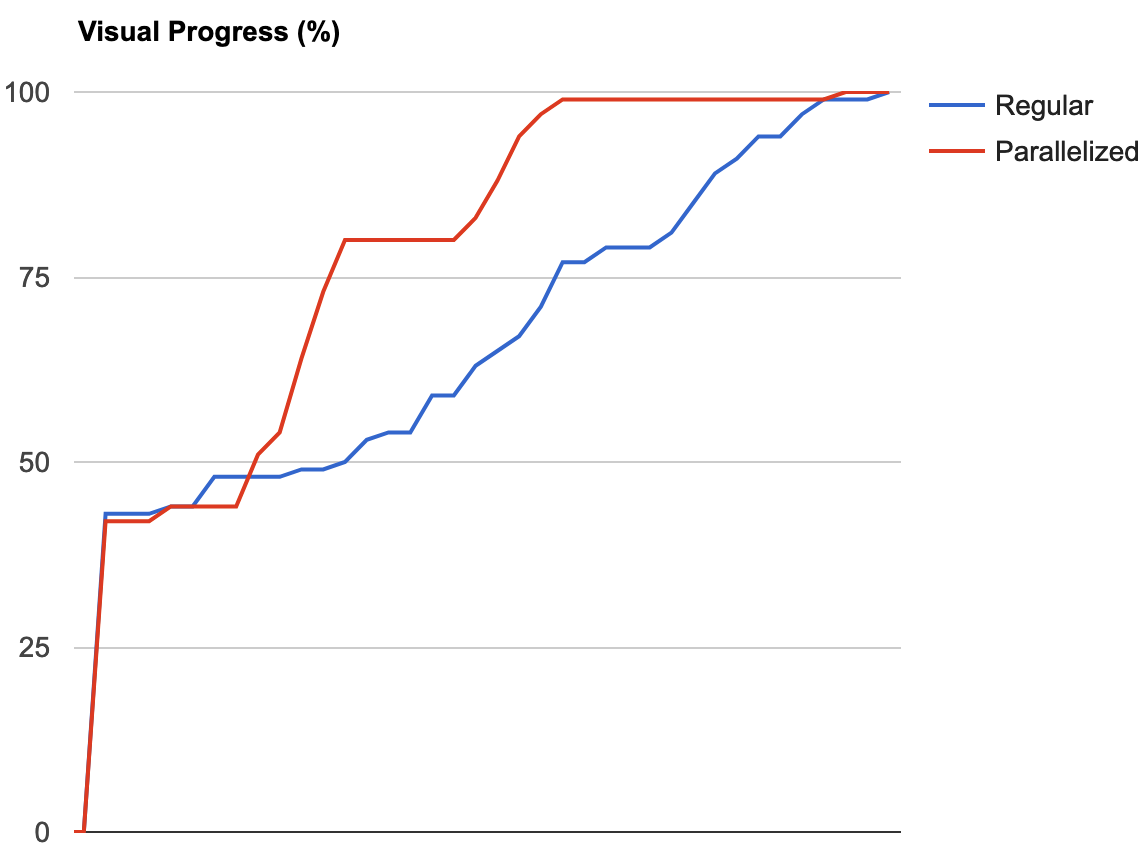
Speed Index attempts to quantify the value of the filmstrip rather than using a single paint timing. The speed index measures the rate at which content is displayed - essentially the area above the curve. In the chart below from our progressive image feature you can see reaching 80% happens much earlier for the parallelized (red) load rather than the regular (blue).
Importance of interactivity
The same impatient user is now happy that the content they want to see has appeared. They will still become frustrated if they are unable to interact with the site.
Time to Interactive is the time it takes for content to be rendered and the page is ready to receive input from the user. Technically this is defined as when the browser’s main processing thread has been idle for several seconds after first meaningful paint.
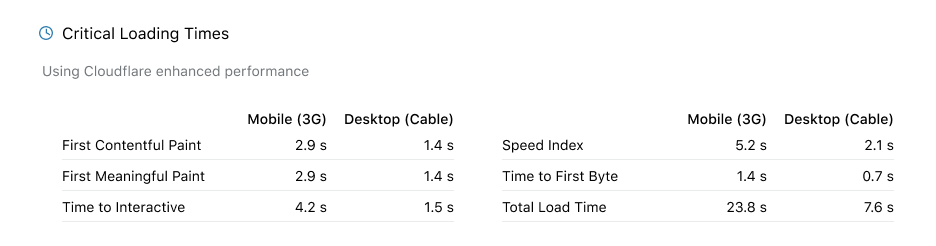
The Speed Tab displays these key metrics for mobile and desktop.
How much faster on Cloudflare ?
The Cloudflare Dashboard provides a list of performance features which can, admittedly, be both confusing and daunting. What would be the benefit of turning on Rocket Loader and on which performance metrics will it have the most impact ? If you upgrade to Pro what will be the value of the enhanced HTTP/2 prioritisation ? The optimization section answers these questions.
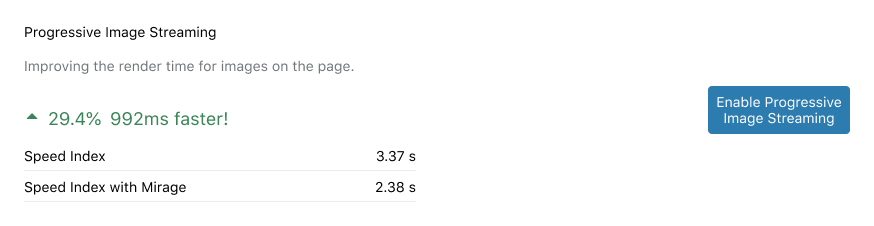
Tests are run with each performance feature turned on and off. The values for the tests for the appropriate performance metrics are displayed, along with the improvement. You can enable or upgrade the feature from this view. Here are a few examples :
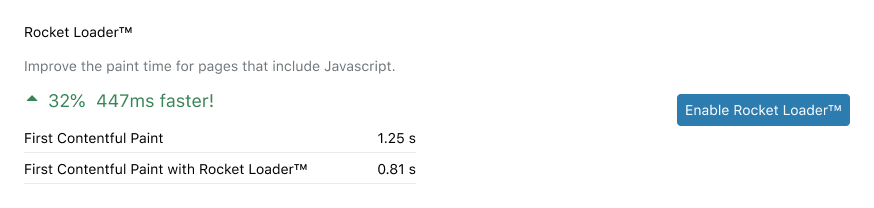
If Rocket Loader were enabled for this website, the render-blocking JavaScript would be deferred causing first paint time to drop from 1.25s to 0.81s - an improvement of 32% on desktop.
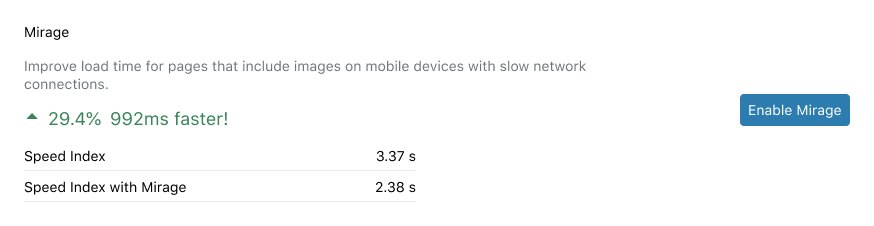
Image heavy sites do not perform well on slow mobile connections. If you enable Mirage, your customers on 3G connections would see meaningful content 1s sooner - an improvement of 29.4%.
So how about our new features?
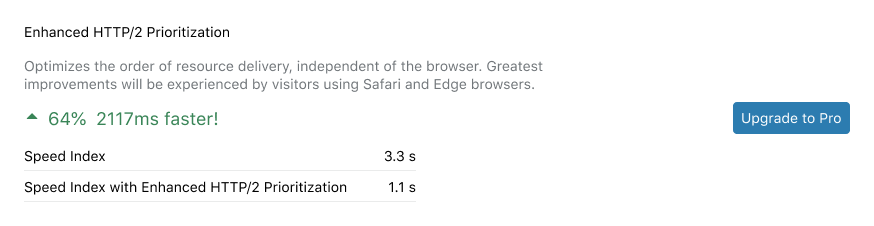
We tested the enhanced HTTP/2 prioritisation feature on an Edge browser on desktop and saw meaningful content display 2s sooner - an improvement of 64%.
This is a more interesting result taken from the blog example used to illustrate the progressive image streaming. At first glance the improvement of 29% in speed index is good. The filmstrip comparison shows a more significant difference. In this case the page with no images shown is already 43% visually complete for both scenarios after 1.5s. At 2.5s the difference is 77% compared to 50%.
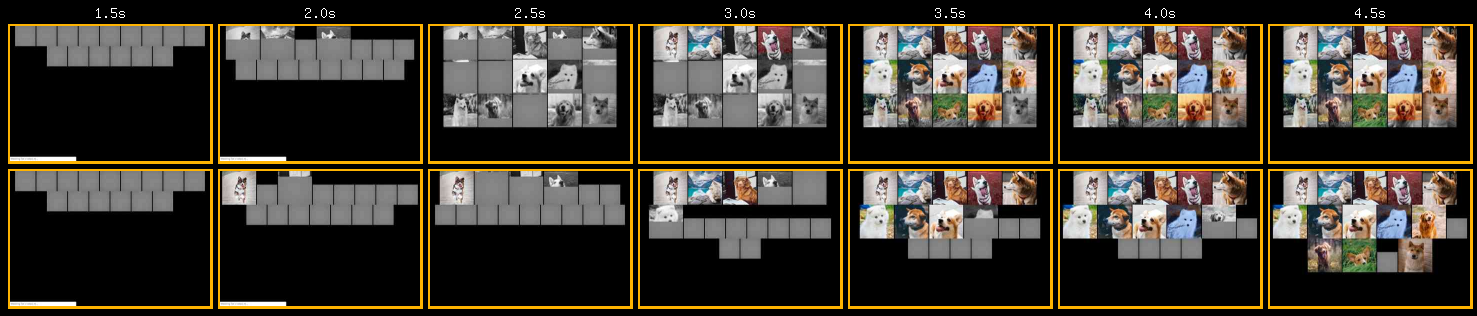
This is a great example of how metrics do not tell the full story. They cannot completely replace viewing the page loading flow and understanding what is important for your site.
How to try
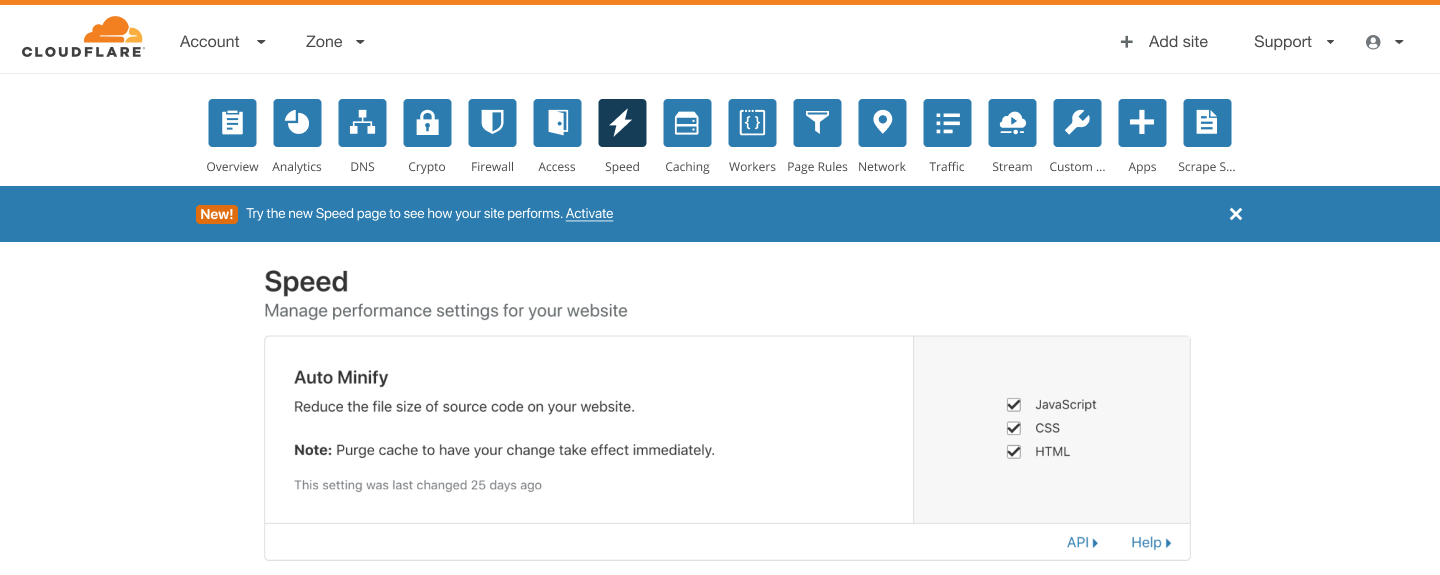
This is our first iteration of the new Speed Page and we are eager to get your feedback. We will be rolling this out to beta customers who are interested in seeing how their sites perform. To be added to the queue for activation of the new Speed Page please click on the banner on the overview page,
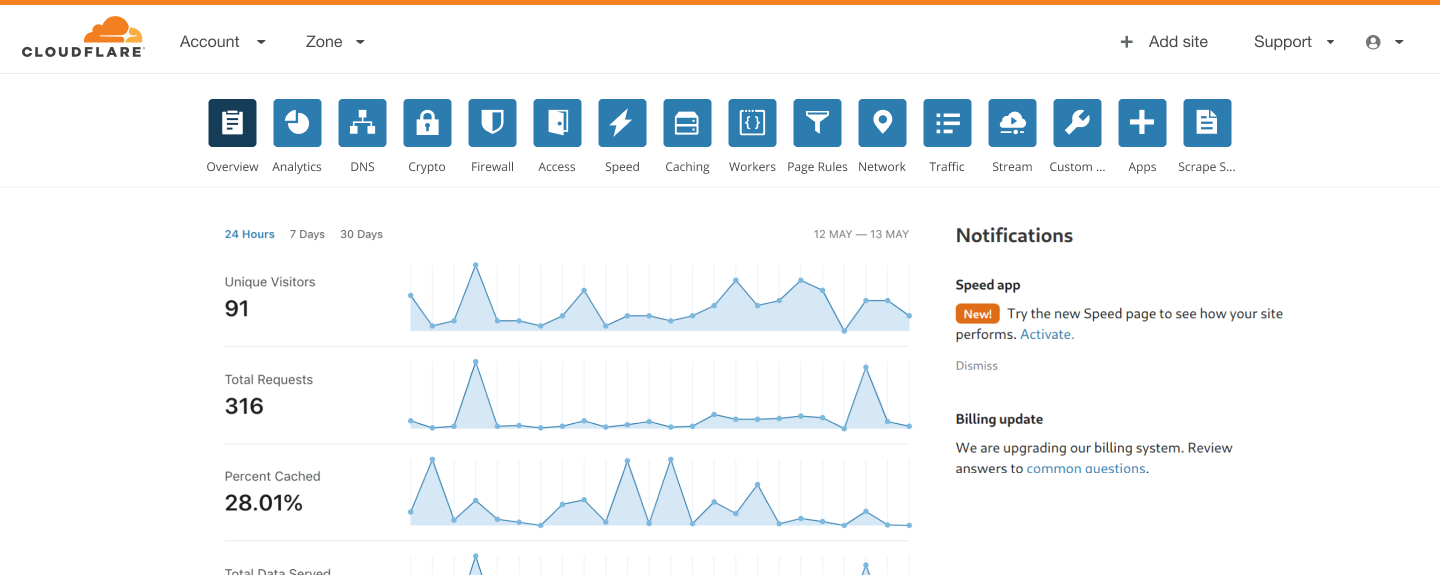
or click on the banner on the existing Speed Page.