
We constantly measure our own network’s performance against other networks, look for ways to improve our performance compared to them, and share the results of our efforts. Since June 2021, we’ve been sharing benchmarking results we’ve run against other networks to see how we compare.
In this post we are going to share the most recent updates since our last post in September, and talk about how we are getting as fast as we are.
How we stack up
Since June 2021, we’ve been taking a close look at the most reported eyeball-facing ISPs and taking actions for the specific networks where we have some room for improvement. Cloudflare was already the fastest provider for TCP Connection time at the 95th percentile for 44% of the networks around the world (we define a network as country and AS number pair). We chose this metric to show how our network helps make your websites faster by getting you to where your customers are. Taking a look at the numbers, in July 2022, Cloudflare was ranked #1 in 33% of the networks and was within 2 ms (95th percentile TCP Connection Time) or 5% of the #1 provider for 8% of the networks that we measured. For reference, our closest competitor was the fastest for 20% of networks.
As of August 30, 2023, Cloudflare was the fastest provider for 44% of networks — and was within 2 ms (95th percentile TCP Connection Time) or 5% of the fastest provider for 10% of the networks that we measured—whereas our closest competitor (Amazon Cloudfront) was the fastest for 19% of networks. As of February 15, 2024, we are still #1 in 44% of networks for 95th percentile TCP Connection Time. Let’s dig into the data.
Lightning fast
Looking at 95th percentile TCP connect times from November 18, 2023, to February 15, 2024, Cloudflare is the #1 provider in 44% of the top 1000 networks:
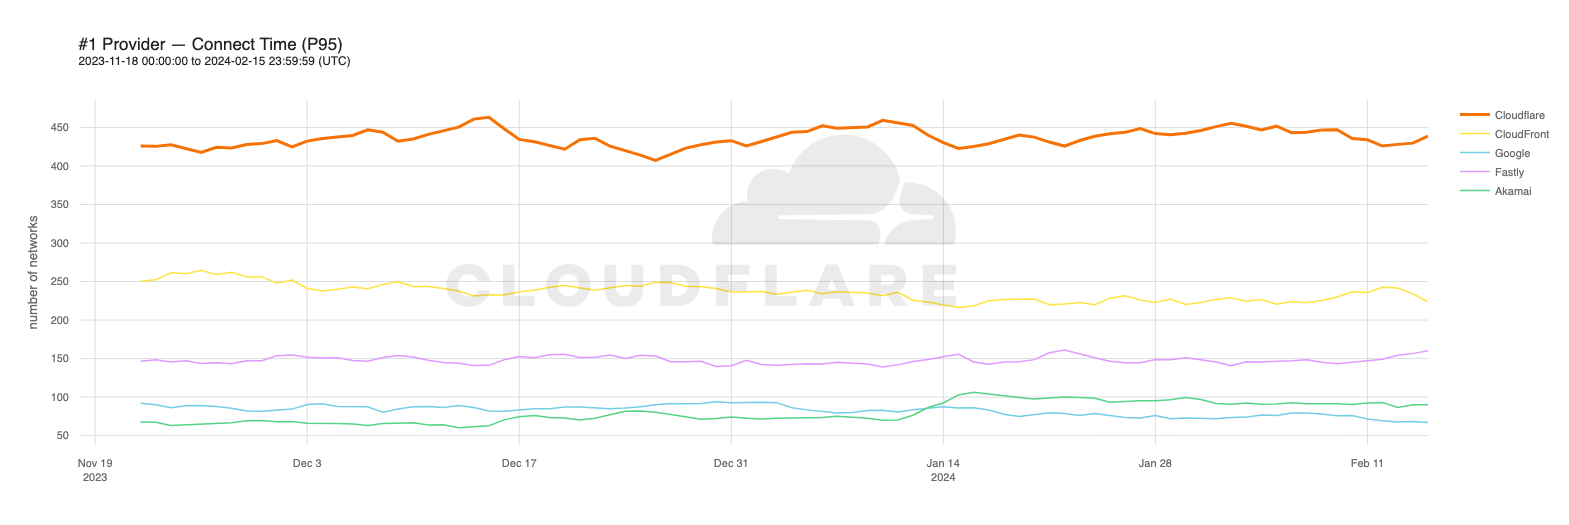
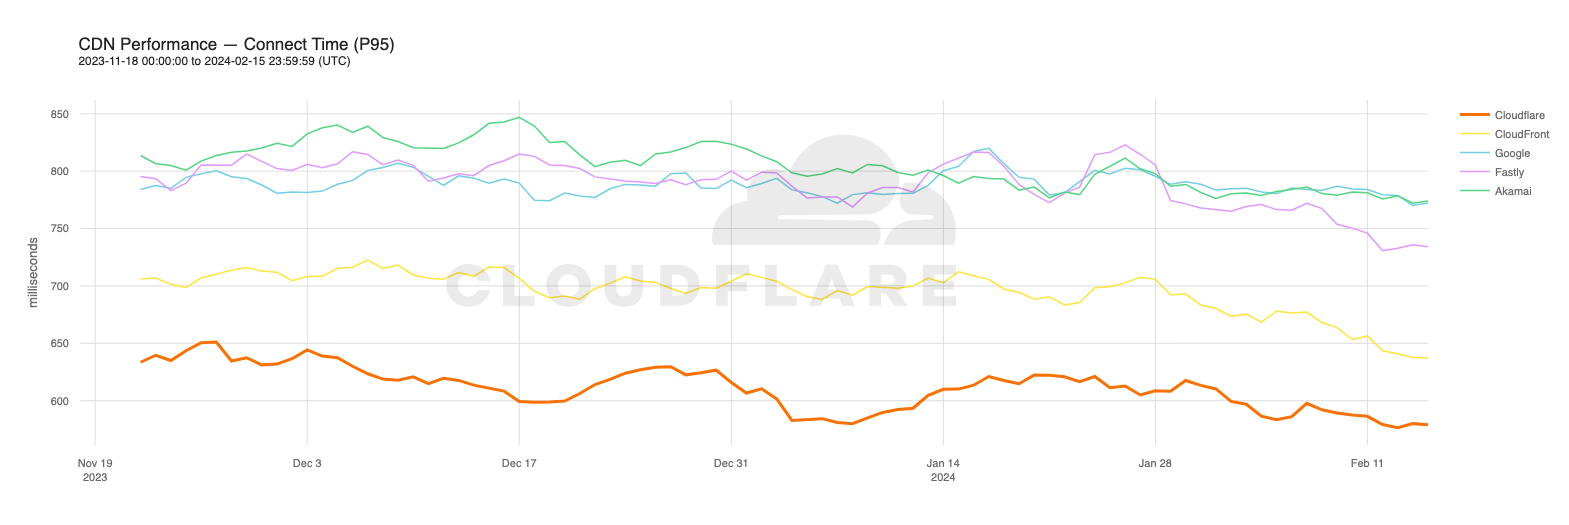
Our P95 TCP Connection time has been trending down since November, and we are consistently 50ms faster at P95 than our closest competitor (Amazon CloudFront):
| Connect time comparisons between providers at 50th and 95th percentile | ||
|---|---|---|
| P50 Connect (ms) | P95 Connect (ms) | |
| Cloudflare | 130 | 579 |
| Amazon | 145 | 637 |
| 190 | 772 | |
| Akamai | 195 | 774 |
| Fastly | 189 | 734 |
These graphs show that day over day, Cloudflare was consistently the fastest provider. They also show the gaps between Cloudflare and the other competitors. When you look at the 95th percentile, Cloudflare is almost 200ms faster than Akamai across the world for connect times. This shows that our network reaches more places and allows users to get their content faster than Akamai on a consistent basis.
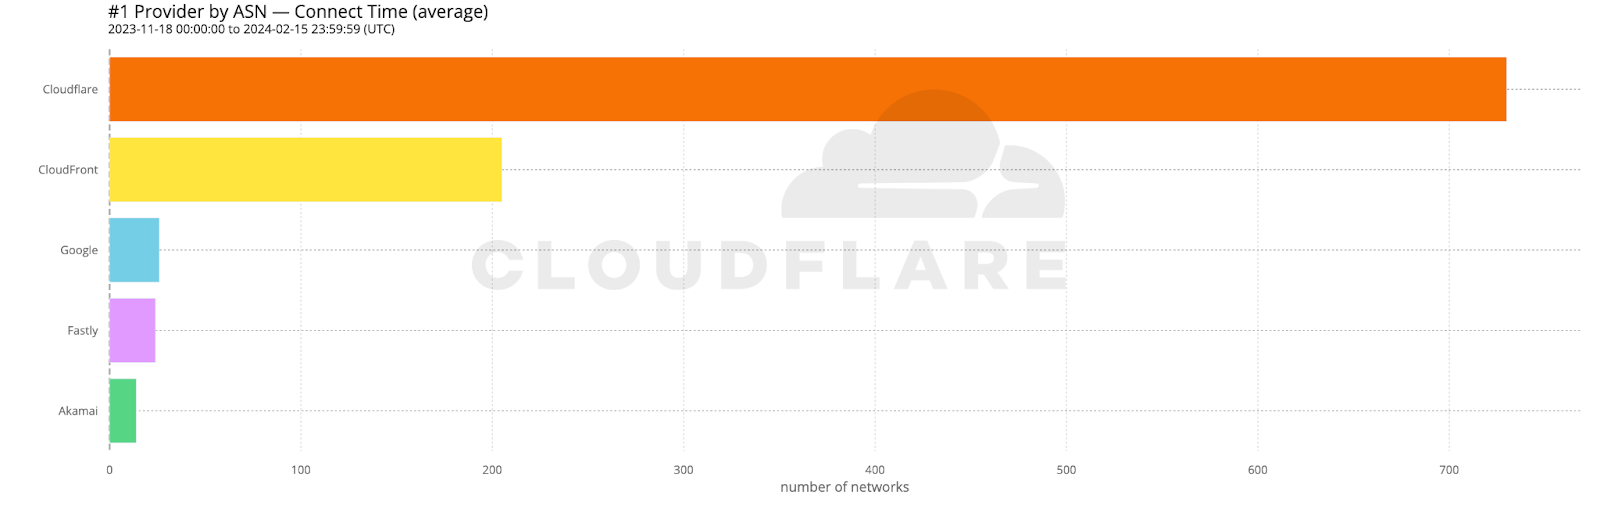
When we aggregate this data over the whole time period, Cloudflare is the fastest in the most networks. For that whole time span of November 18, 2023, to February 15, 2024, Cloudflare was number 1 in 73% of networks for mean TCP connection time:
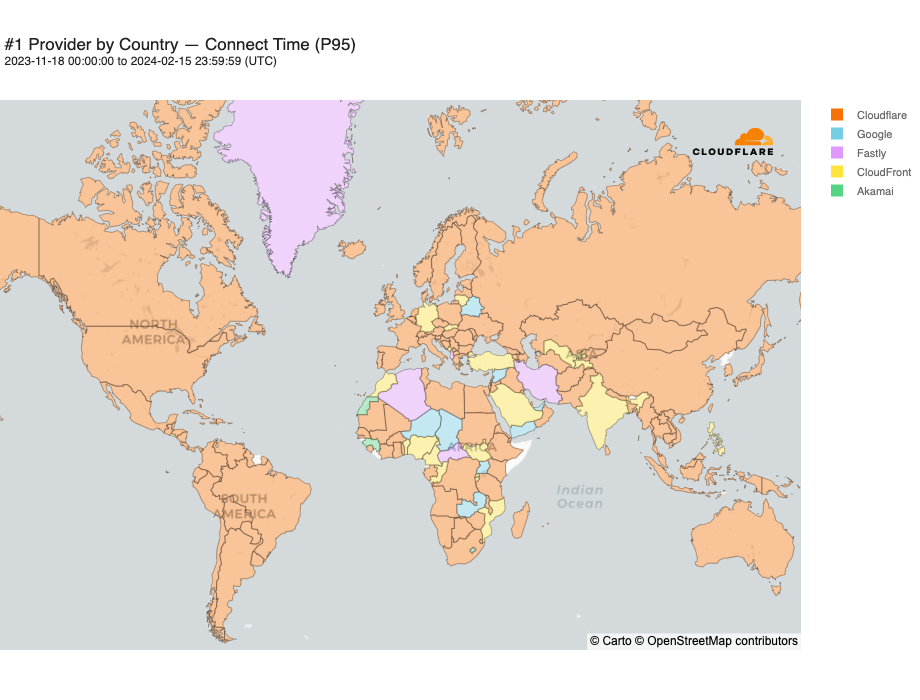
Looking at a map plotting by 95th percentile TCP connect time, Cloudflare is the fastest in the most countries, and you can see this by the fact that most of the map is orange:
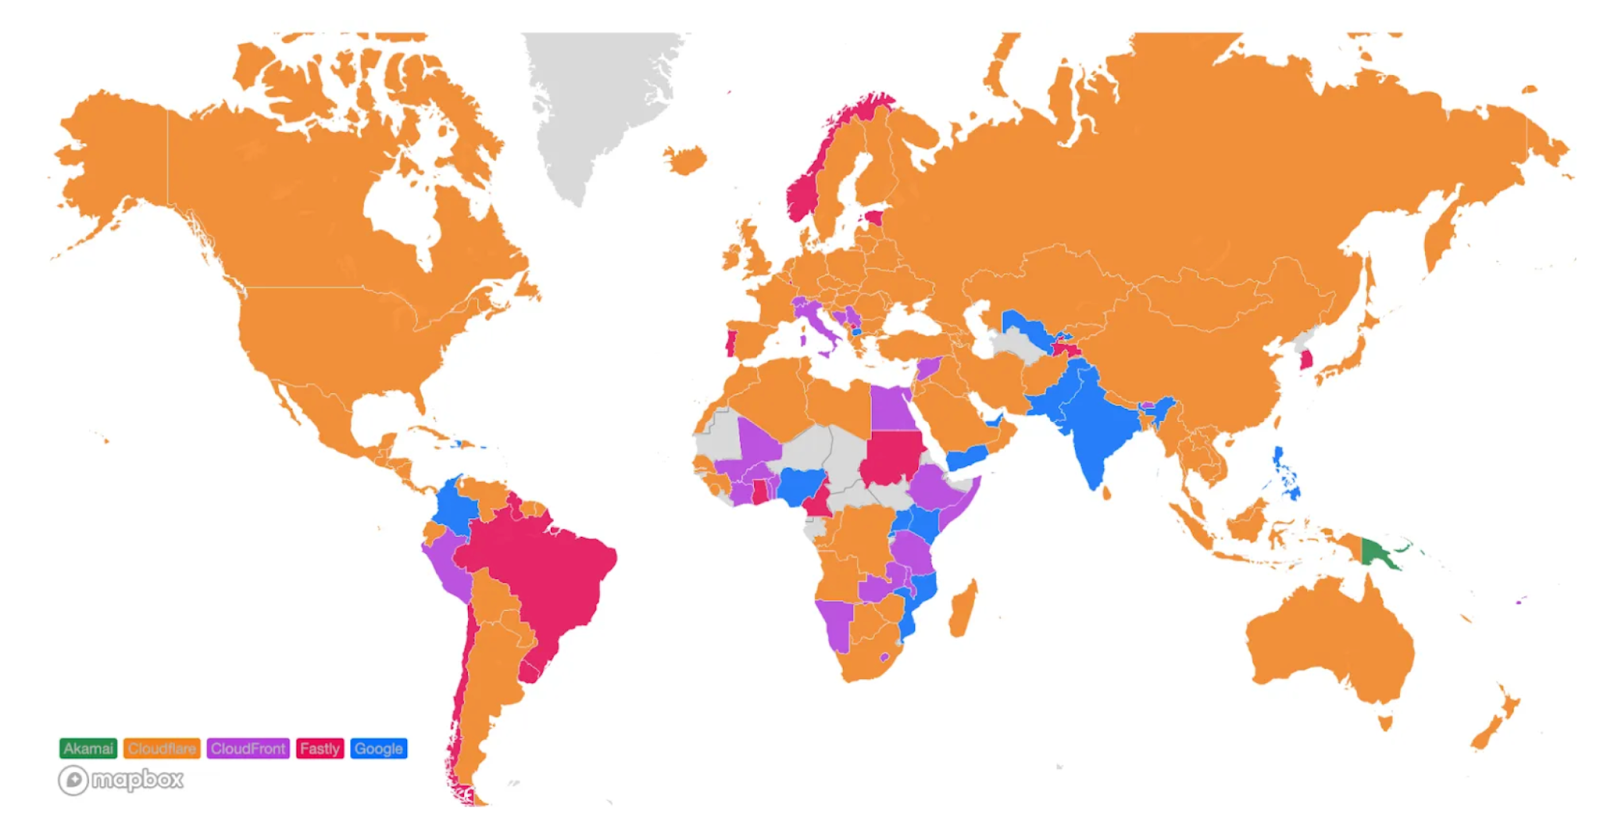
For comparison, here’s what the map looked like in September 2023:
These numbers show that we’re reducing the overall TCP connection time around the world while simultaneously staying ahead of the competition. Let’s talk about how we get these numbers and what we’re doing to make you even faster.
Measuring What Matters
As a quick reminder, here’s how we get the data for our measurements: when users receive a Cloudflare-branded error page, we use Real User Measurements (RUM) and fetch a small file from Cloudflare, Akamai, Amazon CloudFront, Fastly, and Google Cloud CDN. Browsers around the world report the performance of those providers from the perspective of the end-user network they are on. The goal is to provide an accurate picture of where different providers are faster, and more importantly, where Cloudflare can improve. You can read more about the methodology in the original Speed Week blog post.
Using the RUM data, we measure various performance metrics, such as TCP Connection Time, Time to First Byte (TTFB), and Time to Last Byte (TTLB), for ourselves and other providers.
If we only collect data from a browser when we return an error page, you could see how variable the data can get: if one network or website is having a problem in a certain country, that country could overreport, meaning those networks would be more highly weighted in the calculations because more users reported from that network during a given time period.
For example, if a lot of users connecting over a small Brazilian network were generating reports because their websites were throwing errors more frequently, that could make this small network look a lot bigger to us. This small network in Brazil could have as many reports as Claro, a major network in the region, despite them being totally different when you look at the number of subscribers. If we only look at the networks that report to us the most, it could cause smaller networks with fewer subscribers to be treated as more important because of point-in-time error conditions.
This phenomenon could cause the networks we look at to change week over week. Going back to the Brazil example, if the website that was throwing a bunch of errors fixed their problem, and we no longer saw measurements from that network, they may not show up as a “most reported network” depending on when we look at the data. This means that the networks we look at to consider where we are fastest are dependent on which networks are sending us the most reports at any given time, which is not optimal if we’re trying to get faster in these networks. We need to be able to get a consistent signal on these networks to understand where we’re faster and where we’re not.
We’ve addressed this issue by creating a fixed list of the networks we want to look at. We did this by looking at public stats on user population by network and then comparing that with our sample sizes by network until we identified the 1000 networks we want to examine. This ensures that day over day, the networks we look at are the same.
Now let’s talk about what makes us faster in more places than other networks: HTTP/3.
Blazing fast speeds with HTTP/3
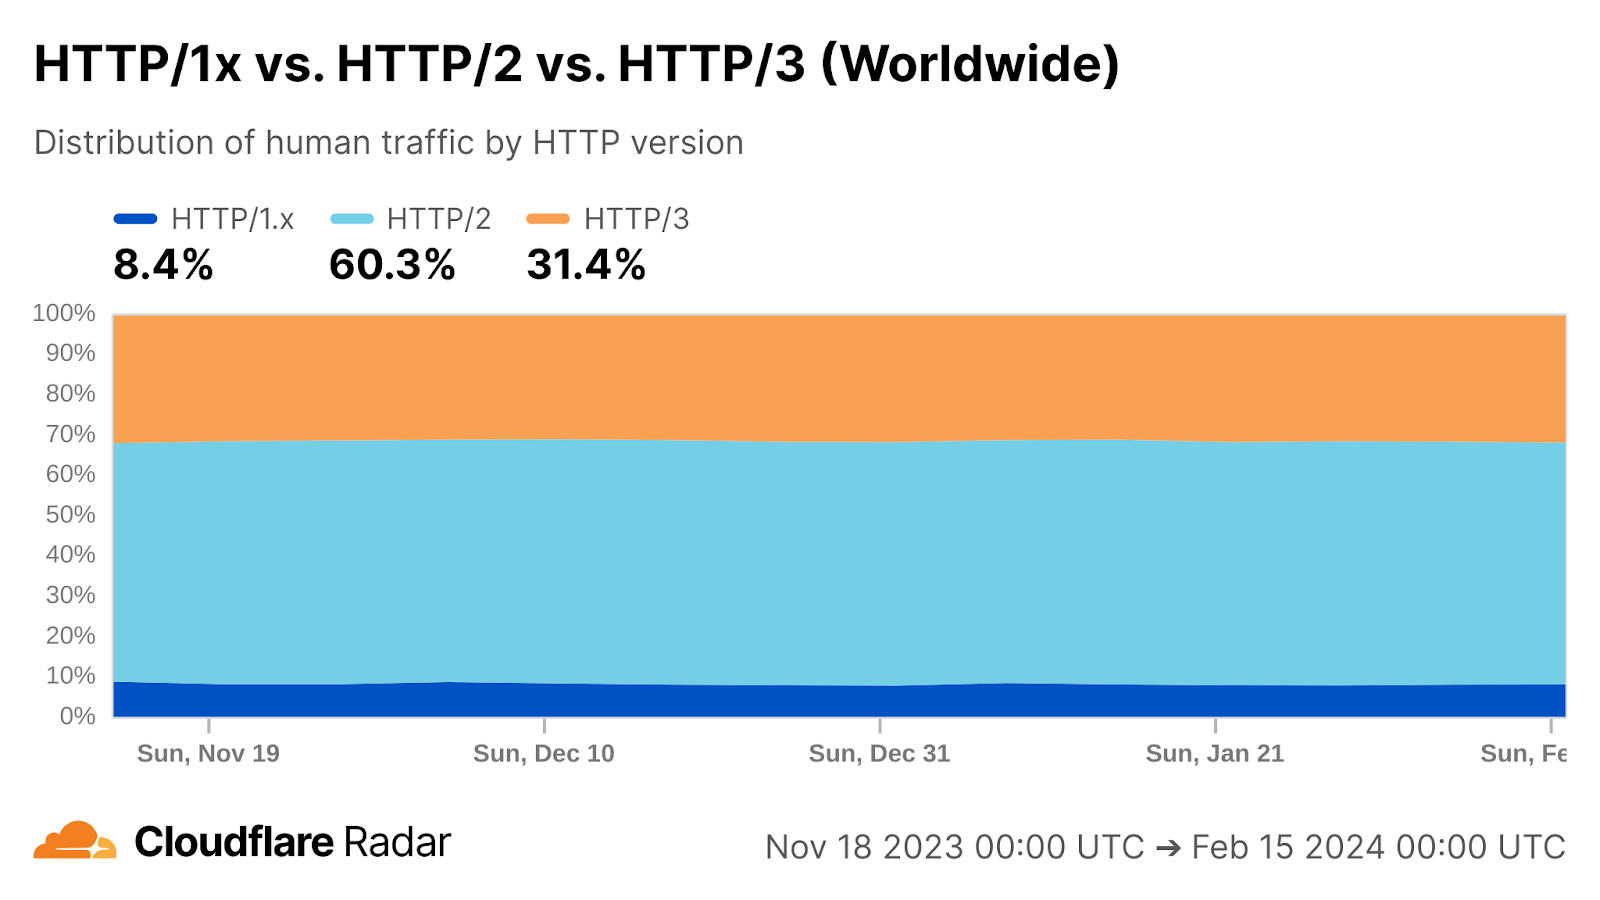
One reason why Cloudflare is the fastest in the most networks is because we’ve been leading the charge with adoption and usage of HTTP/3 on our platform. HTTP/3 allows for faster connectivity behavior which means we can get connections established faster and get data flowing. HTTP/3 is currently used by around 31% of Internet traffic:
To show that HTTP/3 improves connection times, we looked at two different Cloudflare endpoints that these tests ran against: one with HTTP/3 enabled and one with HTTP/3 disabled. The performance difference between the two is night and day. Here’s a table showing the performance difference for 95th percentile connect time between Cloudflare zones when one zone has HTTP/3 enabled:
| P50 connect (ms) | P95 connect (ms) | |
|---|---|---|
| Cloudflare HTTP/3 | 130 | 579 |
| Cloudflare non-HTTP/3 | 174 | 695 |
At P95, Cloudflare is 116 ms faster for connection times when HTTP/3 is enabled. This performance gain helps us be the fastest in the most networks.
But why does HTTP/3 help make us faster? HTTP/3 allows for faster connection setup times, which lets us take greater advantage of our global network footprint to be the fastest in the most networks. HTTP/3 is built on top of the QUIC protocol, which multiplexes UDP packets to allow for parallel streams to be sent at the same time. This means that TLS encryption can happen in parallel with connection establishment, shortening the amount of time that is needed to set up a secure connection. Paired with Cloudflare’s network that is incredibly close to end-users, this makes for significant latency reductions on user Connect times. All major browsers have HTTP/3 enabled by default, so you too can realize these latency improvements by enabling HTTP/3 on your website today.
What’s next
We’re sharing our updates on our journey to become #1 everywhere so that you can see what goes into running the fastest network in the world. From here, our plan is the same as always: identify where we’re slower, fix it, and then tell you how we’ve gotten faster.