


At the end of last year, we introduced Standalone Health Checks - a service that lets you monitor the health of your origin servers and avoid the need to purchase additional third party services. The more that can be controlled from Cloudflare decreases maintenance cost, vendor management, and infrastructure complexity. This is important as it ensures you are able to scale your infrastructure seamlessly as your company grows. Today, we are introducing Standalone Health Check Analytics to help decrease your time to resolution for any potential issues. You can find Health Check Analytics in the sub-menu under the Traffic tab in your Cloudflare Dashboard.
As a refresher, Standalone Health Checks is a service that monitors an IP address or hostname for your origin servers or application and notifies you in near real-time if there happens to be a problem. These Health Checks support fine-tuned configurations based on expected codes, interval, protocols, timeout and more. These configurations enable you to properly target your checks based on the unique setup of your infrastructure. An example of a Health Check can be seen below which is monitoring an origin server in a staging environment with a notification set via email.
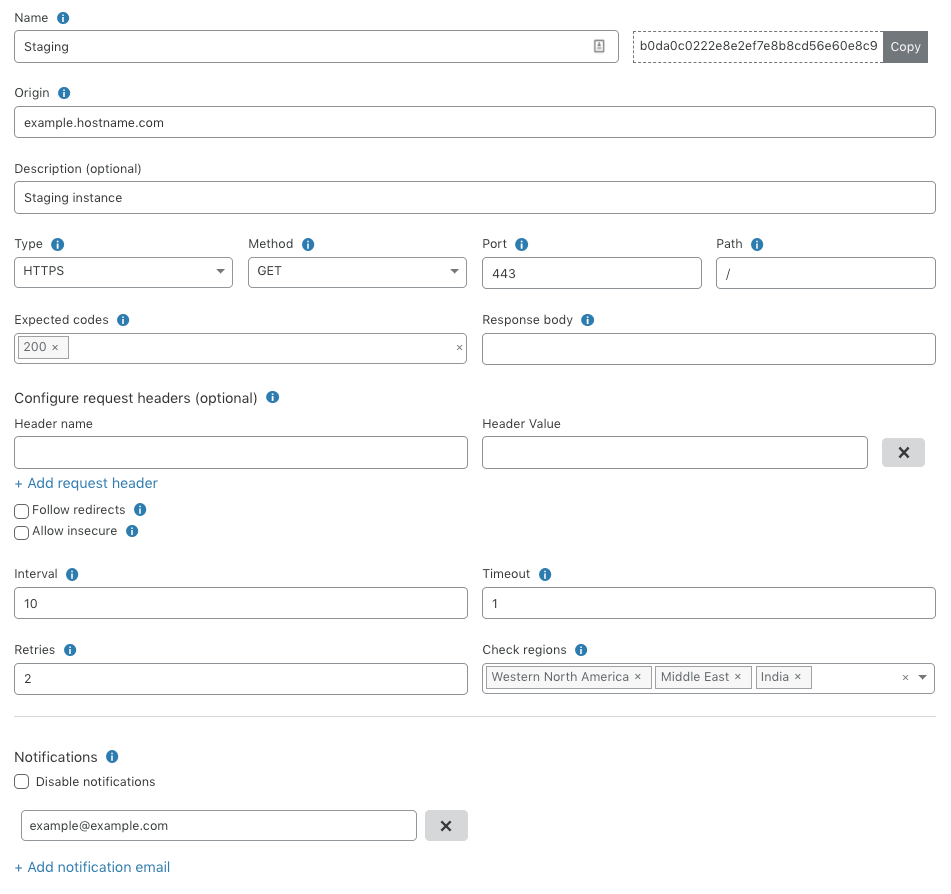
Once you set up a notification, you will be alerted when there is a change in the health of your origin server. In the example above, if your staging environment starts responding with anything other than a 200 OK response code, we will send you an email within seconds so you can take the necessary action before customers are impacted.
Introducing Standalone Health Check Analytics
Once you get the notification email, we provide tools that help to quickly debug the possible cause of the issue with detailed logs as well as data visualizations enabling you to better understand the context around the issue. Let’s walk through a real-world scenario and see how Health Check Analytics helps decrease our time to resolution.
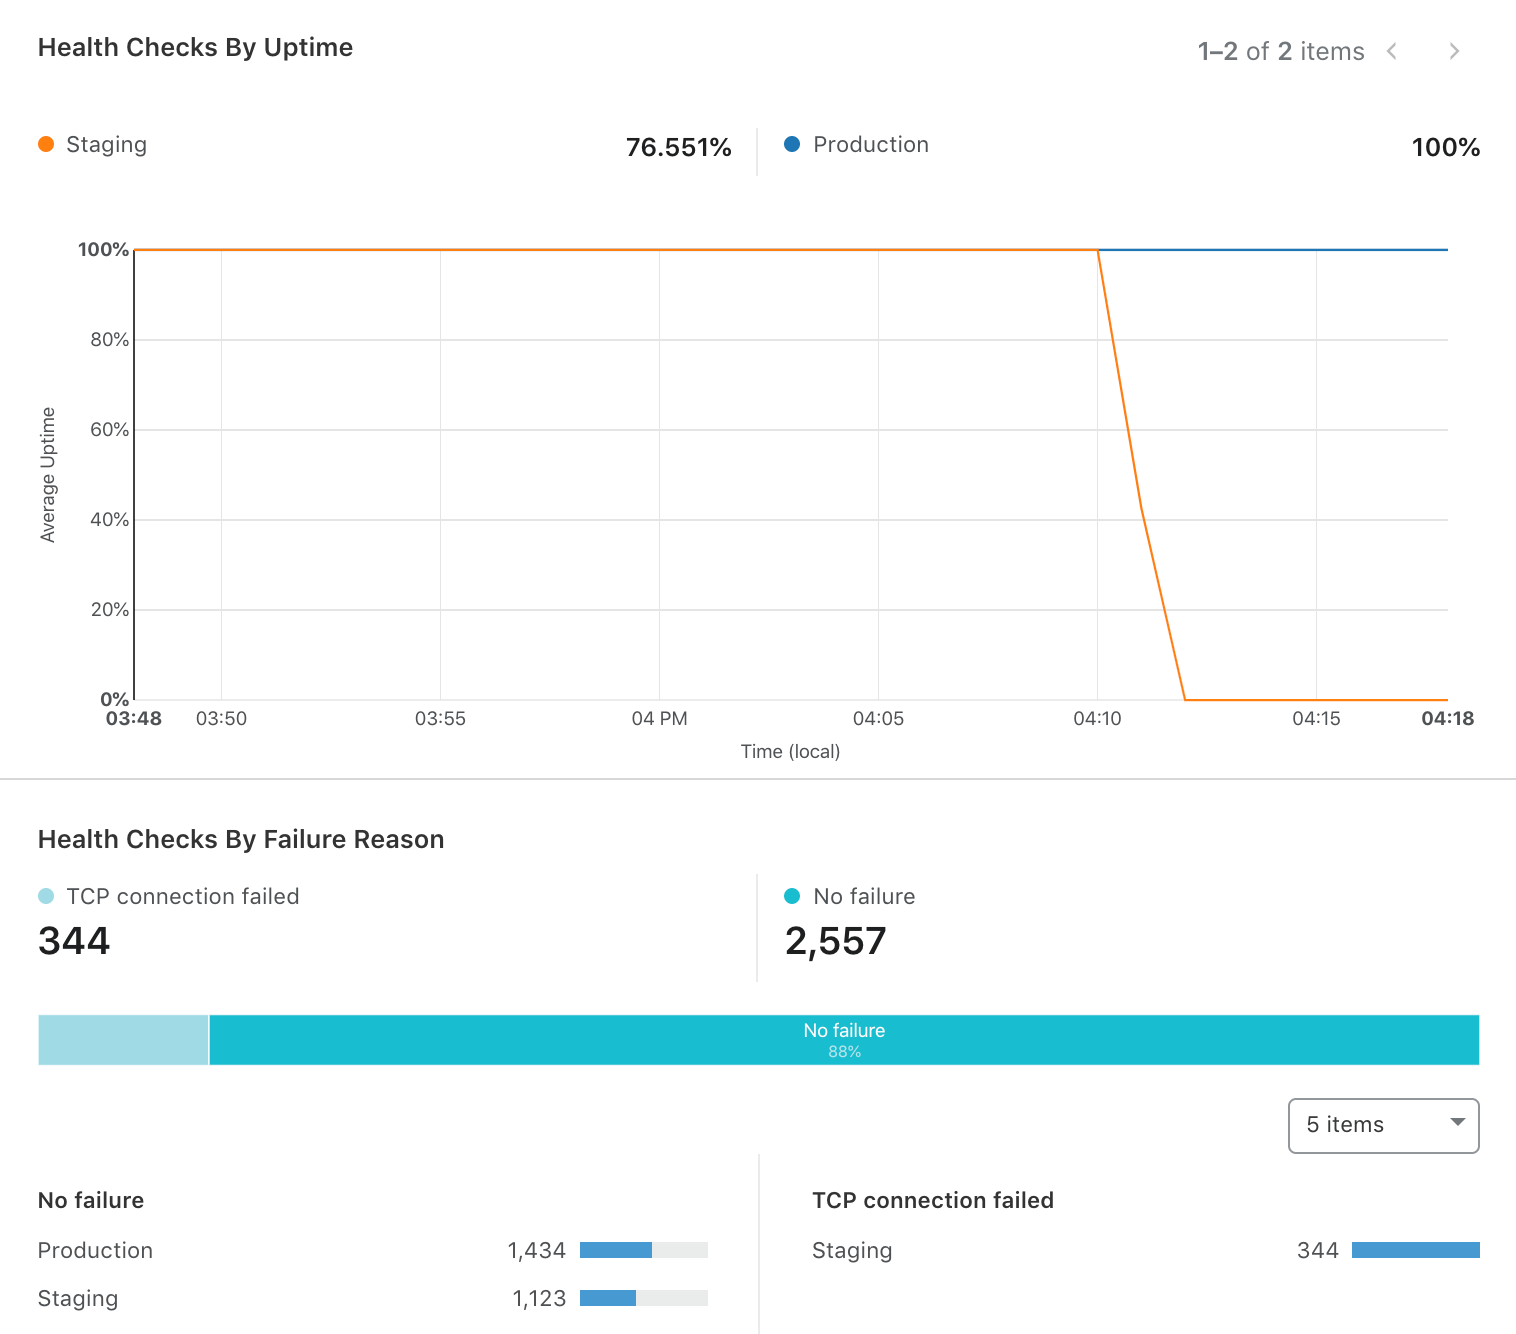
A notification email has been sent to you letting you know that Staging is unhealthy. You log into your dashboard and go into Health Check Analytics for this particular Health Check. In the screenshot below, you can see that Staging is up 76% of the time vs 100% of the time for Production. Now that we see the graph validating the email notification that there is indeed a problem, we need to dig in further. Below the graph you can see a breakdown of the type of errors that have taken place in both the Staging and Production addresses over the specified time period. We see there is only one error taking place, but very frequently, in the staging environment - a TCP Connection Failed error, leading to the lower availability.
This starts to narrow the funnel for what the issue could be. We know that there is something wrong with either the Staging server's ability to receive connections, maybe an issue during the SYN-ACK handshake, or possibly an issue with the router being used and not an issue with the origin server at all but instead receiving a down-stream consequence. With this information, you can quickly make the necessary checks to validate your hypothesis and minimize your time to resolution. Instead of having to dig through endless logs, or try to make educated guesses at where the issue could stem from, Health Check Analytics allows you to quickly hone in on detailed areas that could be the root cause. This in turn maximizes your application reliability but more importantly, keeps trust and brand expectation with your customers.
Being able to quickly understand an overview of your infrastructure is important, but sometimes being able to dig deeper into each healthcheck can be more valuable to understand what is happening at a granular level. In addition to general information like address, response-code, round trip time (RTT) and failure reason, we are adding more features to help you understand the Health Check result(s). We have also added extra information into the event table so you can quickly understand a given problem. In the case of a Response Code Mismatch Error, we now provide the expected response code for a given Health Check along with the received code. This removes the need to go back and check the configuration that may have been setup long ago and keep focus on the problem at hand.
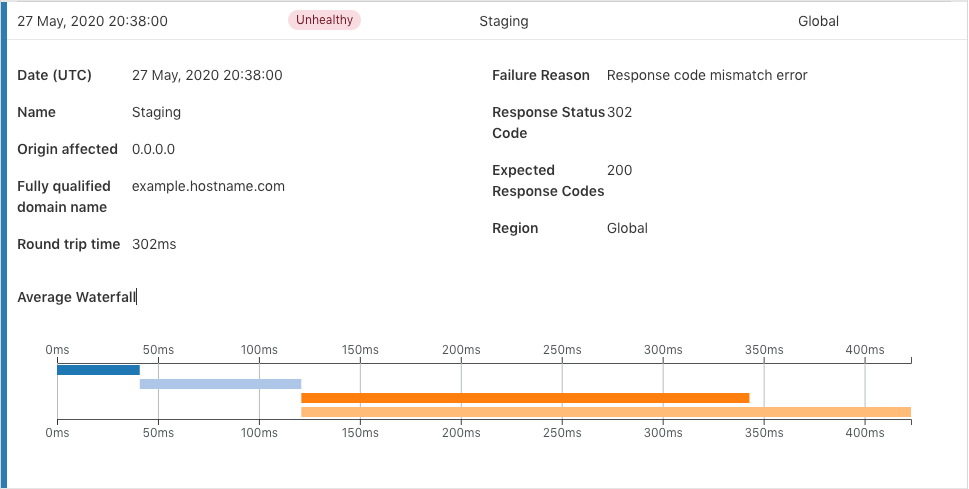
The availability of different portions of your infrastructure is very important, but this does not provide the complete view. Performance is continuing to skyrocket in importance and value to customers. If an application is not performant, they will quickly go to a competitor without a second thought. Sometimes RTT is not enough to understand why requests have higher latency and where the root of the issue may reside. To better understand where time is spent for a given request, we are introducing the waterfall view of a request within the Event Log. With this view, you can understand the time taken for the TCP connection, time taken for the TLS handshake, and the time to first byte (TTFB) for the request. The waterfall will give you a chronological idea about time spent in different stages of the request.
- Time taken for establishing the initial TCP connection.(in dark blue, approx 41ms)
- Once the TCP connection is established, time is spent doing the TLS handshake. This is another component that takes up time for HTTPS websites. (in light blue, approx 80ms)
- Once the SYN-ACK handshake and connection is complete, then the time taken for the first byte to be received is also exposed. (in dark orange, approx 222ms)
- The total round trip time (RTT) is the time taken to load the complete page once the TLS handshake is complete. The difference between the RTT and the TTFB gives you the time spent downloading content from a page. If your page has a large amount of content, the difference between TTFB and RTT will be high. (in light orange, approx 302ms). The page load time is approximately 80 ms for the address.
Using the information above lends to a number of steps that can be taken for the website owner. The delay in initial TCP connection time could be decreased by making the website available in different geo locations around the world. This could also reduce the time for TLS handshake as each round trip will be faster. Another thing that is visible is the page load time of 80ms. This might be because of the contents of the page, maybe compression can be applied on the server side to make the load time better or unnecessary content can be removed. The information in the waterfall view can also tell if an additional external library increases the time to load the website after a release.
Cloudflare has over 200 edge locations around the world making it one of the largest Anycast networks on the planet. When a health check is configured, it can be run across the different regions on the Cloudflare infrastructure, enabling you to see the variation in latency around the world for specific Health Checks.
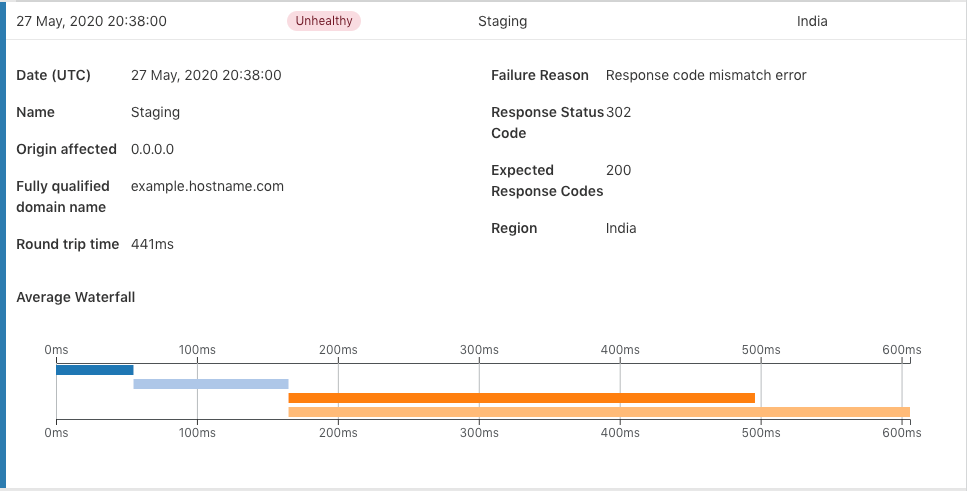
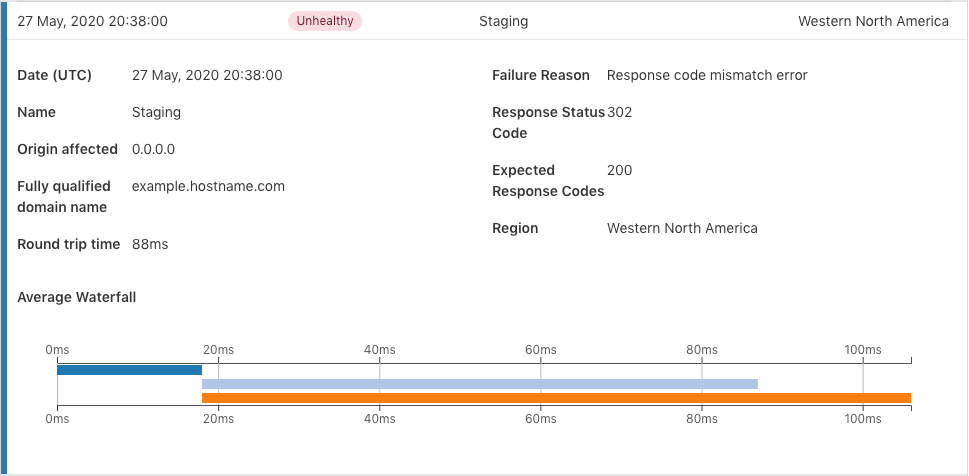
Based on the new information provided from Health Check Analytics, users can definitively validate that the address performs better from Western North America compared to India due to the page load time and overall RTT.
How do health checks run?
To understand and decipher the logs that are found in the analytics dashboard, it is important to understand how Cloudflare runs the Health Checks. Cloudflare has data centers in more than 200 cities across 90+ countries throughout the world [more]. We don’t run health checks from every single of these data centers (that would be a lot of requests to your servers!). Instead, we let you pick between one and thirteen regions from which to run health checks [Regions].
The Internet is not the same everywhere around the world. So your users may not have the same experience on your application according to where they are. Running Health Checks from different regions lets you know the health of your application from the point of view of the Cloudflare network in each of these regions.
Imagine you configure a Health Check from two regions, Western North America and South East Asia, at an interval of 10 seconds. You may have been expecting to get two requests to your origin server every 10 seconds, but if you look at your server’s logs you will see that you are actually getting six. That is because we send Health Checks not just from one location in each region but three.
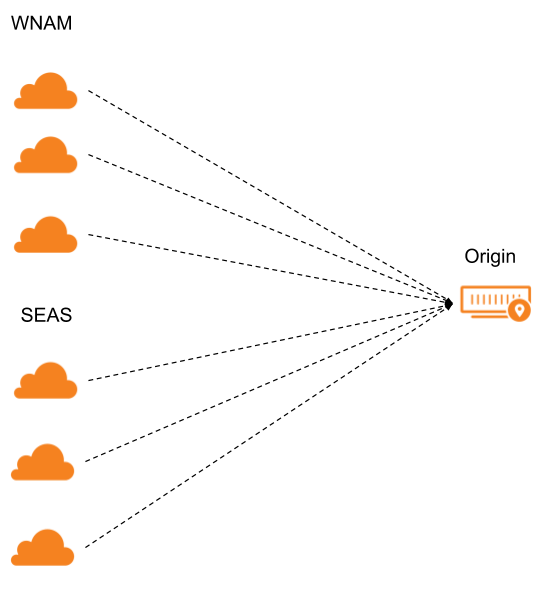
For a health check configured from All Regions (thirteen regions) there will be 39 requests to your server per configured interval.
You may wonder: ‘Why do you probe from multiple locations within a region?’ We do this to make sure the health we report represents the overall performance of your service as seen from that region. Before we report a change, we check that at least two locations agree on the status. We added a third one to make sure that the system keeps running even if there is an issue at one of our locations.
Conclusion
Health Check Analytics is now live and available to all Pro, Business and Enterprise customers! We are very excited to help decrease your time to resolution and ensure your application reliability is maximised.