


As developers, we’ve all experienced times when our code doesn’t work like we expect it to. Whatever the root cause is, being able to quickly dive in, diagnose the problem, and ship a fix is invaluable.
If you’re developing with Cloudflare Workers, we provide many tools to help you debug your applications; from your local environment all the way into production. This additional insight helps save you time and resources and provides visibility into how your application actually works — which can help you optimize and refactor code even before it goes live.
In this post, we’ll explore some of the tools we currently offer, and do a deep dive into one specific area — breakpoint debugging — looking at not only how to use it, but how we recently implemented it in our runtime, workerd.
Available Debugging Tools
Logs
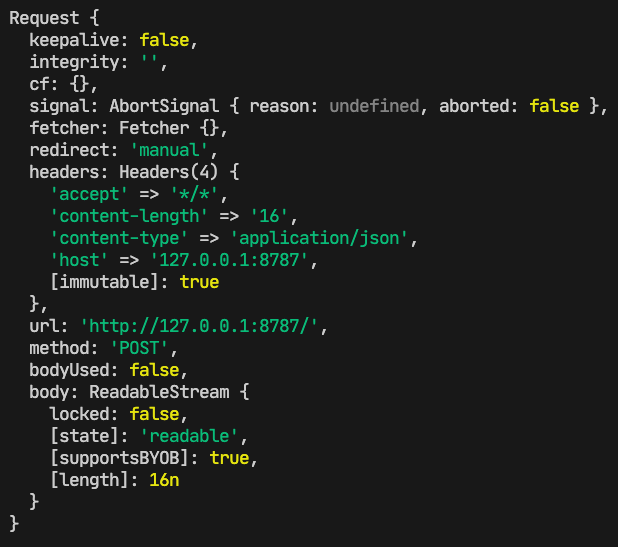
console.log. It might be the simplest tool for a developer to debug, but don’t underestimate it. Built into the Cloudflare runtime is node-like logging, which provides detailed, color-coded logs. Locally, you can view these logs in a terminal window, and they will look like this:
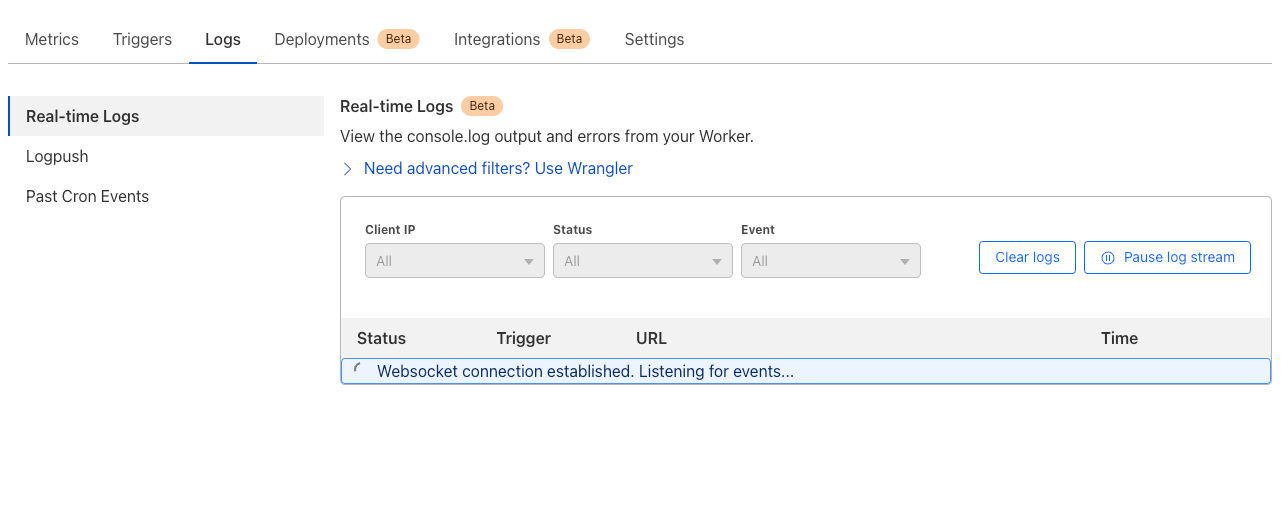
Outside local development, once your Worker is deployed, console.log statements are visible via the Real-time Logs interface in the Cloudflare Dashboard or via the Workers CLI tool, Wrangler, using the wrangler tail command. Each log that comes through wrangler tail is structured JSON, and the command has options to filter and search incoming logs to make results as relevant as possible.
If you’d like to send these logs to third-parties for processing and storage, you can leverage Workers Trace Events Logpush which supports a variety of destinations.
DevTools
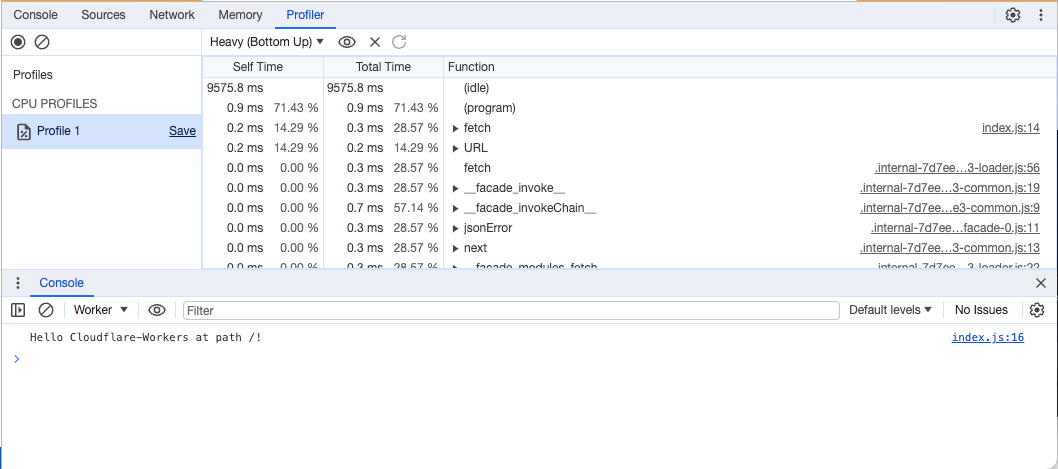
In addition to logging, you can also leverage our implementation of Chrome’s DevTools to do things like view and debug network requests, take memory heap snapshots, and monitor CPU usage.
This interactive tool provides even further insight and information about your Cloudflare Workers, and can be started from within Wrangler by running wrangler dev and pressing [d] once the dev server is spun up. It can also be accessed by the editor that is built into the Cloudflare Dashboard or the Workers Playground.
Breakpoints
Breakpoints allow developers to stop code execution at specific points (lines) to evaluate what is happening. This is great for situations where you might have a race condition or times when you don’t know exactly what is happening, and your code isn’t behaving as expected. Breakpoints allow you to walk through your code line by line to see how it behaves.
You can get started with breakpoint debugging from within the Wrangler CLI by running wrangler dev and pressing [d] to open up a DevTools debugger session. If you prefer to debug via your IDE, we support VSCode and WebStorm.
Setting up VSCode
To set up VSCode to debug Cloudflare Workers with breakpoints, you’ll need to create a new .vscode/launch.json file with the following content:
{
  "configurations": [
    {
  "name": "Wrangler",
  "type": "node",
  "request": "attach",
  "port": 9229,
  "cwd": "/",
  "resolveSourceMapLocations": null,
  "attachExistingChildren": false,
  "autoAttachChildProcesses": false
    }
  ]
}
Once you’ve created this configuration in launch.json, open your project in VSCode. Open a new terminal window from VSCode, and run npx wrangler dev to start a local dev server.
At the top of the Run & Debug panel, you should see an option to select a configuration. Choose Wrangler, and select the play icon. You should see Wrangler: Remote Process [0] show up in the Call Stack panel on the left. Go back to a .js or .ts file in your project and add at least one breakpoint.
Open your browser and go to the Worker’s local URL (default http://127.0.0.1:8787). The breakpoint should be hit, and you should see details about your code at the specified line.
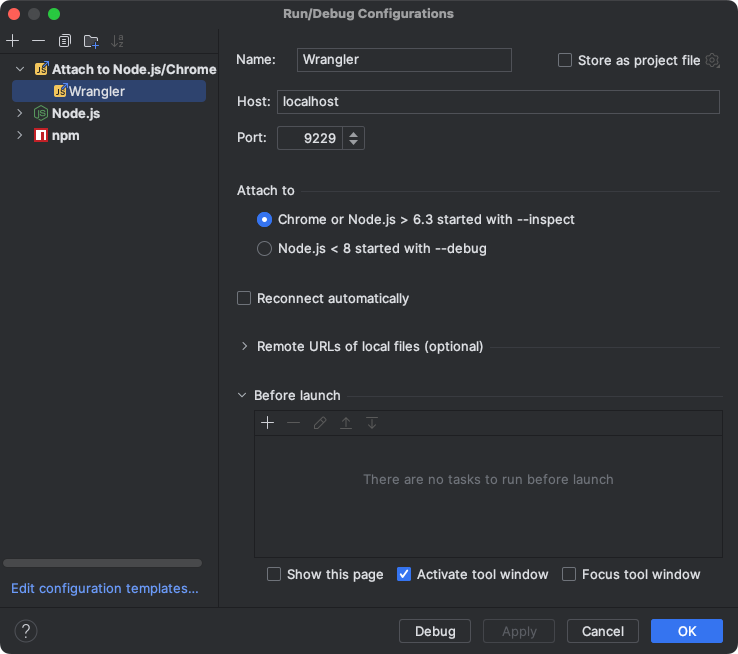
Setting up WebStorm
To set up WebStorm with breakpoint debugging, create a new “Attach to Node.js/Chrome” Debug Configuration, setting the port to 9229:
Run npx wrangler dev to start a local dev server, then start the Debug Configuration:

Add a breakpoint, then open your browser and go to the Worker’s local URL (default http://127.0.0.1:8787). The breakpoint should be hit, and you should see details about your code at the specified line.
How we enabled breakpoint debugging via workerd
Both workerd and Cloudflare Workers embed V8 to run workers code written in JavaScript and WASM. V8 is a component of the world’s most widely used web browser today, Google Chrome, and it is also widely used embedded into open source projects like Node.js.
The Google Chrome team has created a set of web developer tools, Chrome DevTools, that are built directly into the browser. These provide a wide range of features for inspecting, debugging, editing, and optimizing web pages. Chrome DevTools are exposed through a UI in Chrome that talks to the components of the browser, such as V8, using the Chrome DevTools Protocol (CDP). The protocol uses JSON-RPC transmitted over a websocket to exchange messages and notifications between clients, like the DevTools UI, and the components of Chrome. Within Chrome Devtools protocols are domains (DOM, Debugger, Media) that group related commands by functionality that can be implemented by different components in Chrome.
V8 supports the following CDP domains:
- Runtime
- Debugger
- Profiler
- HeapProfiler
These domains are available to all projects that embed V8, including workerd, so long as the embedding application is able to route messages between a DevTools client and V8. DevTools clients use the Debugger domain to implement debugging functionality. The Debugger domain exposes all the commands to debug an application, such as setting breakpoints. It also sends debugger events, like hitting a breakpoint, up to DevTools clients, so they can present the state of the script in a debugger UI.
While workerd has supported CDP since its first release, support for the Debugger domain is new. The Debugger domain differs from the other domains exposed by V8 because it requires the ability to suspend the execution of a script whilst it is being debugged. This presents a complication for introducing breakpoint debugging in workerd, because workerd runs each Worker in a V8 isolate in which there is just a single thread that receives incoming requests and runs the scripts associated with them.
Why is this a problem? Workerd uses an event-driven programming model and its single thread is responsible for both responding to incoming requests and for running JavaScript / WASM code. In practice, this is implemented via an event loop that sits at the bottom of the call stack that sends and receives network messages and calls event handlers that run JavaScript code. The thread needs to fall back into the event loop after running event handlers to be able to process network messages. However, the V8 API for handling breakpoints expects execution to be suspended within a method implemented by the embedder that is called from V8 when a breakpoint is hit. This method is called from the event handler that is running JavaScript in V8. Unfortunately, this prevents the workerd thread from falling back into the event loop and processing any incoming network events, including all CDP commands relating to debugging. So if a client asks to resume execution by sending a CDP command, it cannot be relayed to the executing thread because it is unable to fall into the eventloop whilst in a breakpoint.
We solved this event processing problem by adding an I/O thread to workerd. The I/O thread handles sending and receiving CDP messages, because the thread executing JavaScript can be suspended due to hitting a breakpoint or a JavaScript `debugger` statement. The I/O thread wakes the JavaScript thread when CDP commands arrive and also handles sending responses back to the CDP client. Conceptually, this was not difficult, but it required some careful synchronization to avoid dropped messages.
Use the Source
When debugging, JavaScript developers expect to see their source code in the debugger. For this to work, the embedded V8 needs to be able to locate sources. It is common for JavaScript code to be generated either by combining and minifying multiple JavaScript sources, or by transpiling to JavaScript from another language, such as TypeScript, Dart, CoffeeScript, or Elm. To render the source code in the debugger in its original form, the embedded V8 needs to know 1) where the source code came from and 2) how any given line of JavaScript visible to V8 maps back to the original sources before any transformation of the original sources was applied. The standard solution to this problem is to embed a source map into the JavaScript code that JavaScript engine runs. The embedding is performed through a special comment in the JavaScript running in the JavaScript engine:
//# sourceMappingURL=generated.js.map
This source map’s URL is resolved relative to the source URL. This can be set when instantiating a source file with the V8 API, or via another special comment:
//# sourceURL=file:///absolute/path/to/generated.js
An example source map looks something like this:
{
  "version": 3,
  "sources": ["../src/index.ts"],
  "sourcesContent": ["interface Env { ... }\n\nexport default ..."],
  "mappings": ";AAIA,IAAO,mBAA8B;AAAA,EACjC,MAAM,MAAM,SAAS,KAAK,KAAK;...",
  "names": []
}
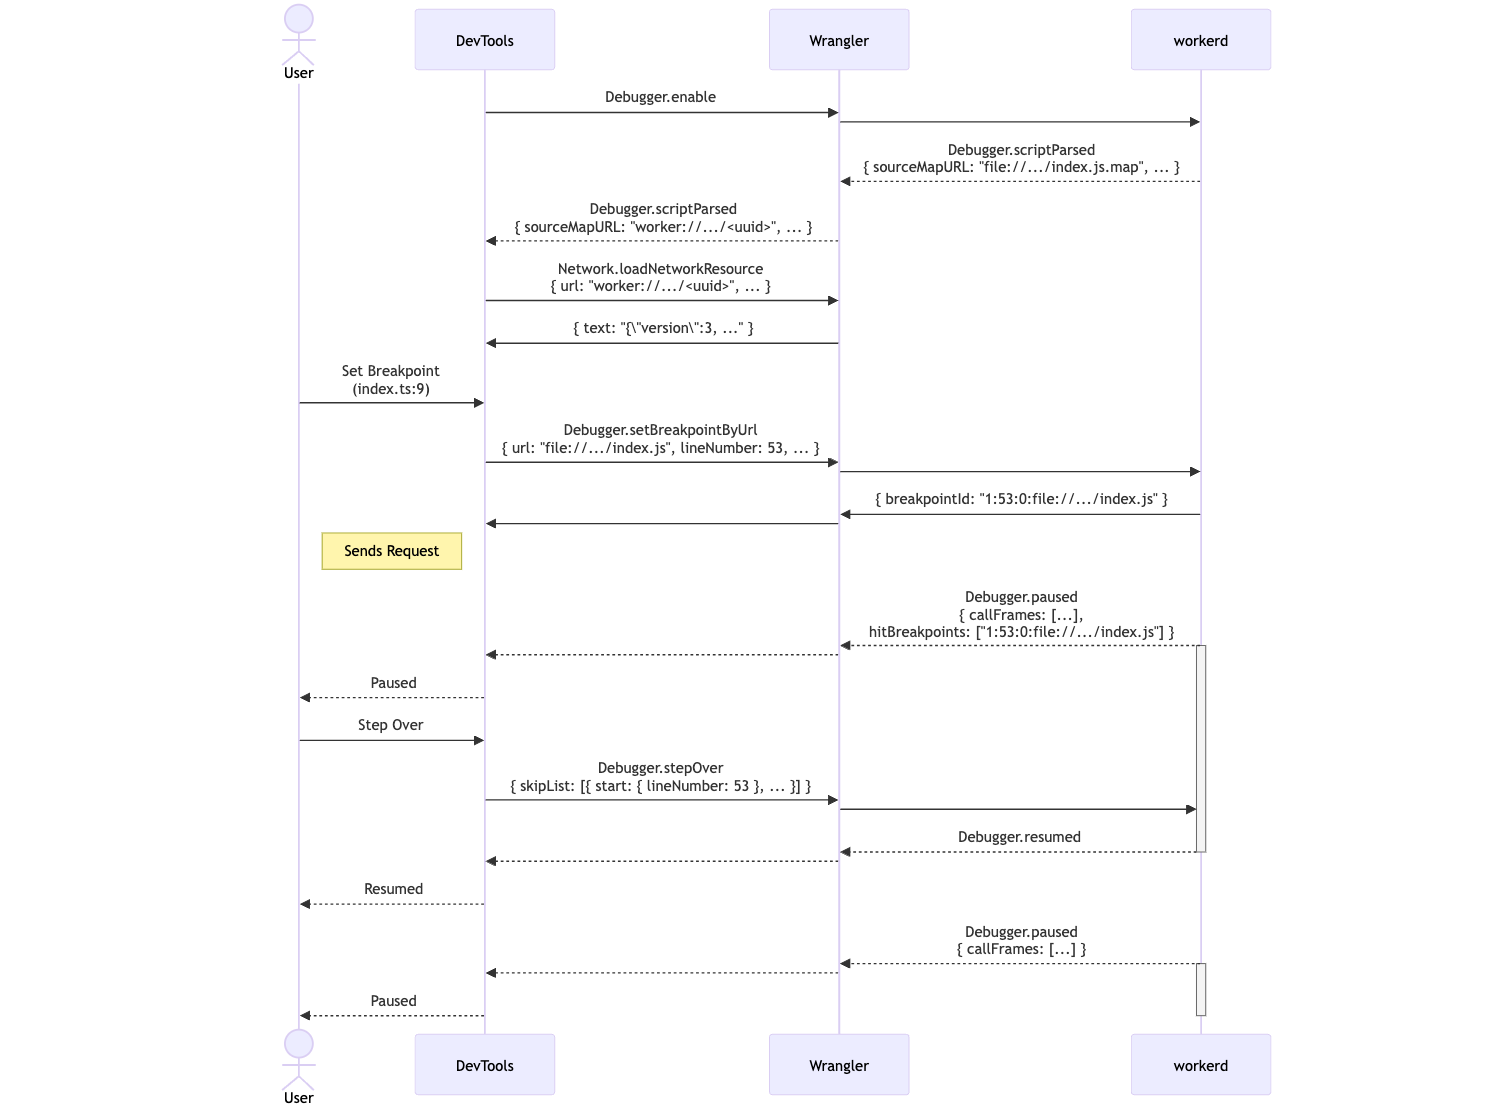
Each of the relative paths in sources are resolved relative to the source map’s fully-qualified URL. When DevTools connects to V8 and enables the Debugger domain, V8 will send information on all parsed scripts including the source map’s fully-qualified URL. In our example, this would be file:///absolute/path/to/generated.js.map. DevTools needs to fetch this URL along with source URLs to perform source mapping. Unfortunately, our patched version of DevTools is hosted at https://devtools.devprod.cloudflare.dev/, and browsers prohibit fetching file:// URLs from non-file:// origins for security reasons. However, we need to use file:// URLs so IDEs like Visual Studio Code can match up source files from source maps to files on disk. To get around this, we used Wrangler's inspector proxy to rewrite the CDP script parsed messages sent by V8 to use a different protocol if the User-Agent of the inspector WebSocket handshake is a browser.
Now that we can set breakpoints and fetch source maps, DevTools works as normal. When a user tries to set a breakpoint in an original source file, DevTools will use the map’s mappings to find the location in the generated JavaScript file and set a breakpoint there. This is the opposite problem to source mapping error stack traces. When V8 hits this JavaScript breakpoint, DevTools will pause on the location in the original source file. Stepping through the source file requires mapping the stepped-over segment to generated code, sending the step-over command to V8, then mapping back the new paused location in generated code to the original source file.
Future Work
Both the Visual Studio Code and WebStorm configurations for breakpoint debugging require attaching to an existing dev server. It would be great if your IDE could launch the dev server too, and automatically attach to it.
When you debug a Node.js program in Visual Studio Code or WebStorm, an additional --require hook is added to the NODE_OPTIONS environment variable. This hook registers the process’s inspector URL with the editor over a well-known socket. This means if your Node.js process spawns another Node.js child process, your editor will debug that child process too. This is how Visual Studio Code’s JavaScript Debug Terminal works, and is how editors can debug Node.js processes started by npm scripts.
Our plan is to detect this --require hook, and register workerd child processes started by Wrangler and Miniflare. This will mean you can debug npm launch tasks, without having to worry about starting the dev server and then attaching to it.
Start debugging!
All the debugging tools listed above are ready to be used today. Logs and DevTools can be accessed either by logging into the Cloudflare dashboard or by downloading Wrangler, the command-line tool for the Cloudflare Developer Platform. Breakpoint debugging and Node-style logging is built into the latest version of Wrangler, and can be accessed by running npx wrangler@latest dev in a terminal window. Let us know what you think in the #wrangler channel on the Cloudflare Developers Discord, and please open a GitHub issue if you hit any unexpected behavior.