
Some time ago I was looking at a hot section in our code and I saw this:
	if (debug) {
    	  log("...");
    }
This got me thinking. This code is in a performance critical loop and it looks like a waste - we never run with the "debug" flag enabled[1]. Is it ok to have if clauses that will basically never be run? Surely, there must be some performance cost to that...
Just how bad is peppering the code with avoidable if statements?
Back in the days the general rule was: a fully predictable branch has close to zero CPU cost.
To what extent is this true? If one branch is fine, then how about ten? A hundred? A thousand? When does adding one more if statement become a bad idea?
At some point the negligible cost of simple branch instructions surely adds up to a significant amount. As another example, a colleague of mine found this snippet in our production code:
const char *getCountry(int cc) {
		if(cc == 1) return "A1";
        if(cc == 2) return "A2";
        if(cc == 3) return "O1";
        if(cc == 4) return "AD";
        if(cc == 5) return "AE";
        if(cc == 6) return "AF";
        if(cc == 7) return "AG";
        if(cc == 8) return "AI";
        ...
        if(cc == 252) return "YT";
        if(cc == 253) return "ZA";
        if(cc == 254) return "ZM";
        if(cc == 255) return "ZW";
        if(cc == 256) return "XK";
        if(cc == 257) return "T1";
        return "UNKNOWN";
}
Obviously, this code could be improved[2]. But when I thought about it more: should it be improved? Is there an actual performance hit of a code that consists of a series of simple branches?
Understanding the cost of jump
We must start our journey with a bit of theory. We want to figure out if the CPU cost of a branch increases as we add more of them. As it turns out, assessing the cost of a branch is not trivial. On modern processors it takes between one and twenty CPU cycles. There are at least four categories of control flow instructions[3]: unconditional branch (jmp on x86), call/return, conditional branch (e.g. je on x86) taken and conditional branch not taken. The taken branches are especially problematic: without special care they are inherently costly - we'll explain this in the following section. To bring down the cost, modern CPU's try to predict the future and figure out the branch target before the branch is actually fully executed! This is done in a special part of the processor called the branch predictor unit (BPU).
The branch predictor attempts to figure out a destination of a branching instruction very early and with very little context. This magic happens before the "decoder" pipeline stage and the predictor has very limited data available. It only has some past history and the address of the current instruction. If you think about it - this is super powerful. Given only current instruction pointer it can assess, with very high confidence, where the target of the jump will be.
The BPU maintains a couple of data structures, but today we'll focus on Branch Target Buffer (BTB). It's a place where the BPU remembers the target instruction pointer of previously taken branches. The whole mechanism is much more complex, take a look a the Vladimir Uzelac's Master thesis for details about branch prediction on CPU's from 2008 era:
For the scope of this article we'll simplify and focus on the BTB only. We'll try to show how large it is and how it behaves under different conditions.
Why is branch prediction needed?
But first, why is branch prediction used at all? In order to get the best performance, the CPU pipeline must feed a constant flow of instructions. Consider what happens to the multi-stage CPU pipeline on a branch instruction. To illustrate let's consider the following ARM program:
	BR label_a;
    X1
    ...
label_a:
 	Y1
Assuming a simplistic CPU model, the operations would flow through the pipeline like this:
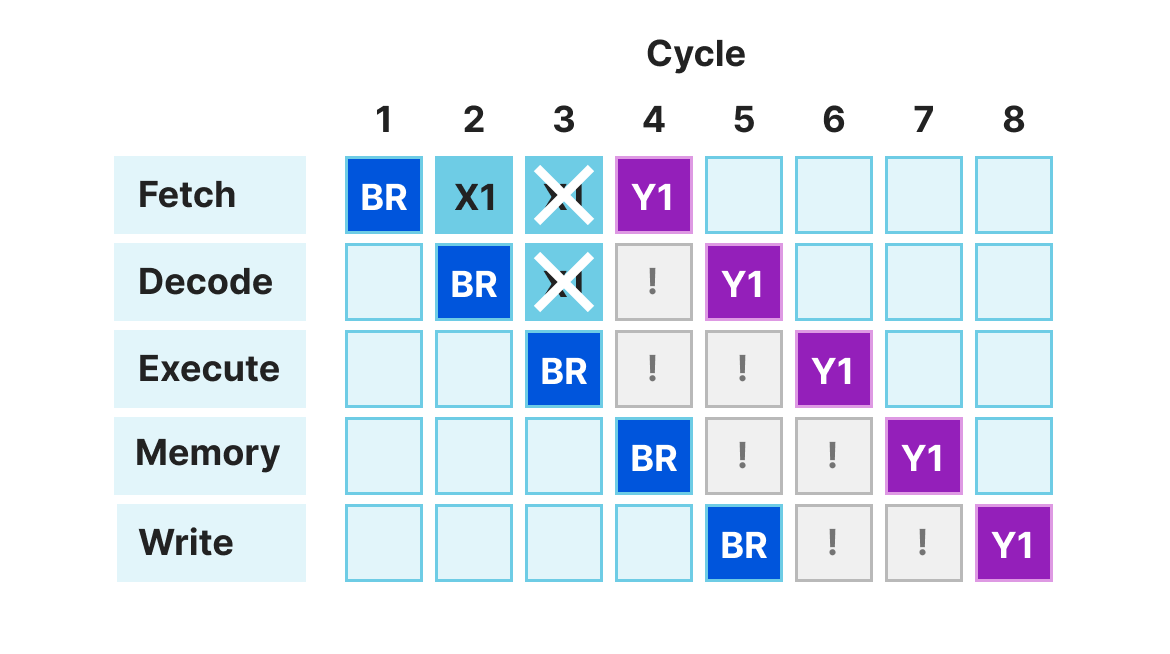
In the first cycle the BR instruction is fetched. This is an unconditional branch instruction changing the execution flow of the CPU. At this point it's not yet decoded, but the CPU would like to fetch another instruction already! Without a branch predictor in cycle 2 the fetch unit either has to wait or simply continues to the next instruction in memory, hoping it will be the right one.
In our example, instruction X1 is fetched even though this isn't the correct instruction to run. In cycle 4, when the branch instruction finishes the execute stage, the CPU will be able to understand the mistake, and roll back the speculated instructions before they have any effect. At this point the fetch unit is updated to correctly get the right instruction - Y1 in our case.
This situation of losing a number of cycles due to fetching code from an incorrect place is called a "frontend bubble". Our theoretical CPU has a two-cycle frontend bubble when a branch target wasn’t predicted right.
In this example we see that, although the CPU does the right thing in the end, without good branch prediction it wasted effort on bad instructions. In the past, various techniques have been used to reduce this problem, such as static branch prediction and branch delay slots. But the dominant CPU designs today rely on dynamic branch prediction. This technique is able to mostly avoid the frontend bubble problem, by predicting the correct address of the next instruction even for branches that aren’t fully decoded and executed yet.
Playing with the BTB
Today we're focusing on the BTB - a data structure managed by the branch predictor responsible for figuring out a target of a branch. It's important to note that the BTB is distinct from and independent of the system assessing if the branch was taken or not taken. Remember, we want to figure out if a cost of a branch increases as we run more of them.
Preparing an experiment to stress only the BTB is relatively simple (based on Matt Godbolt's work). It turns out a sequence of unconditional jmps is totally sufficient. Consider this x86 code:
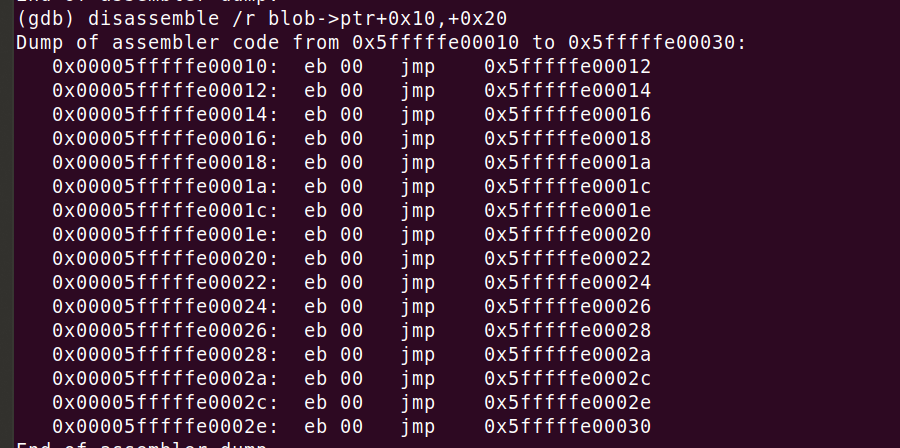
This code stresses the BTB to an extreme - it just consists of a chain of jmp +2 statements (i.e. literally jumping to the next instruction). In order to avoid wasting cycles on frontend pipeline bubbles, each taken jump needs a BTB hit. This branch prediction must happen very early in the CPU pipeline, before instruction decode is finished. This same mechanism is needed for any taken branch, whether it's unconditional, conditional or a function call.
The code above was run inside a test harness that measures how many CPU cycles elapse for each instruction. For example, in this run we're measuring times of dense - every two bytes - 1024 jmp instructions one after another:
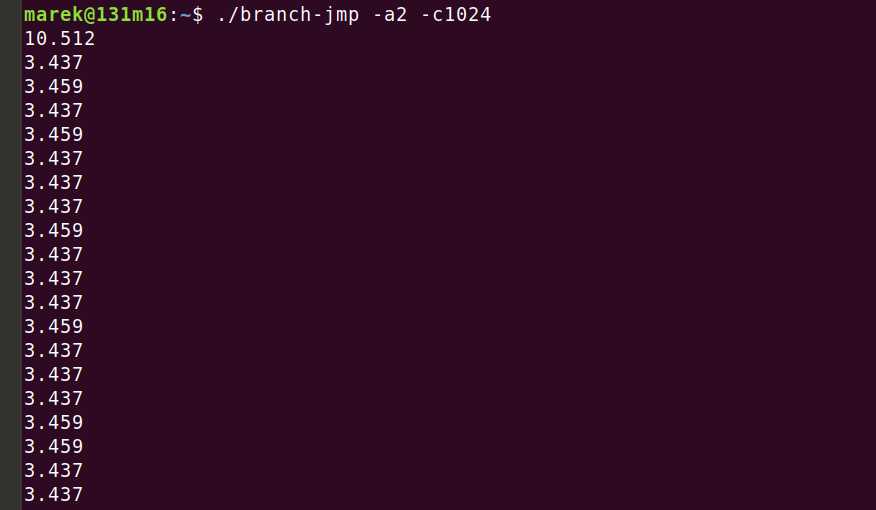
We’ll look at the results of experiments like this for a few different CPUs. But in this instance, it was run on a machine with an AMD EPYC 7642. Here, the cold run took 10.5 cycles per jmp, and then all subsequent runs took ~3.5 cycles per jmp. The code is prepared in such a way to make sure it's the BTB that is slowing down the first run. Take a look at the full code, there is quite some magic to warm up the L1 cache and iTLB without priming the BTB.
Top tip 1. On this CPU a branch instruction that is taken but not predicted, costs ~7 cycles more than one that is taken and predicted. Even if the branch was unconditional.
Density matters
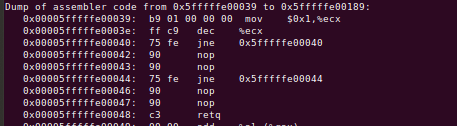
To get a full picture we also need to think about the density of jmp instructions in the code. The code above did eight jmps per 16-byte code block. This is a lot. For example, the code below contains one jmp instruction in each block of 16 bytes. Notice that the nop opcodes are jumped over. The block size doesn't change the number of executed instructions, only the code density:
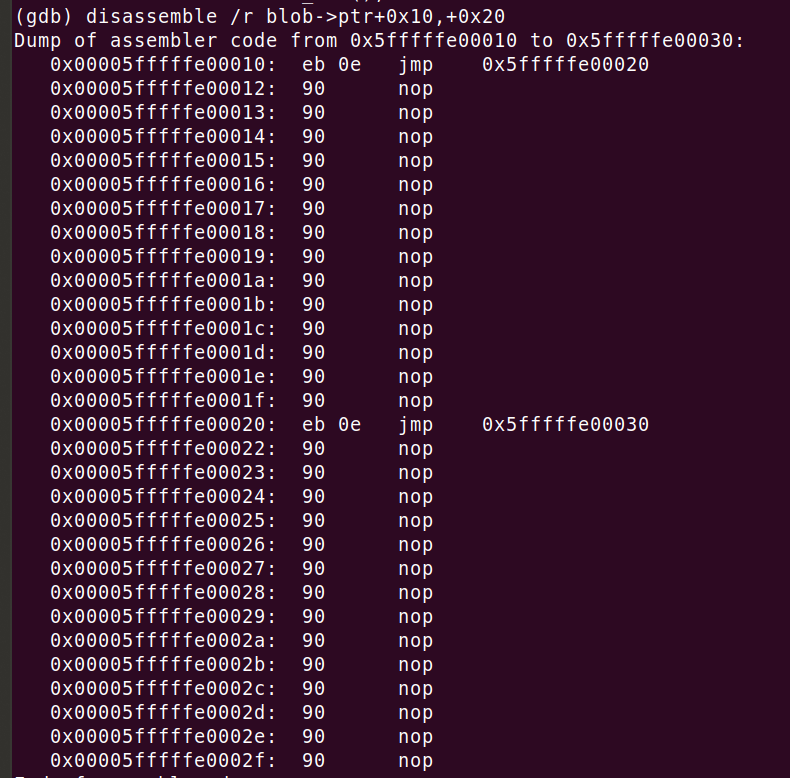
Varying the jmp block size might be important. It allows us to control the placement of the jmp opcodes. Remember the BTB is indexed by instruction pointer address. Its value and its alignment might influence the placement in the BTB and help us reveal the BTB layout. Increasing the alignment will cause more nop padding to be added. The sequence of a single measured instruction - jmp in this case - and zero or more nops, I will call "block", and its size "block size". Notice that the larger the block size, the larger the working code size for the CPU. At larger values we might see some performance drop due to exhausting L1 cache space.
The experiment
Our experiment is crafted to show the performance drop depending on the number of branches, across different working code sizes. Hopefully, we will be able to prove the performance is mostly dependent on the number of blocks - and therefore the BTB size, and not the working code size.
See the code on GitHub. If you want to see the generated machine code, though, you need to run a special command. It's created procedurally by the code, customized by passed parameters. Here's an example gdb incantation:

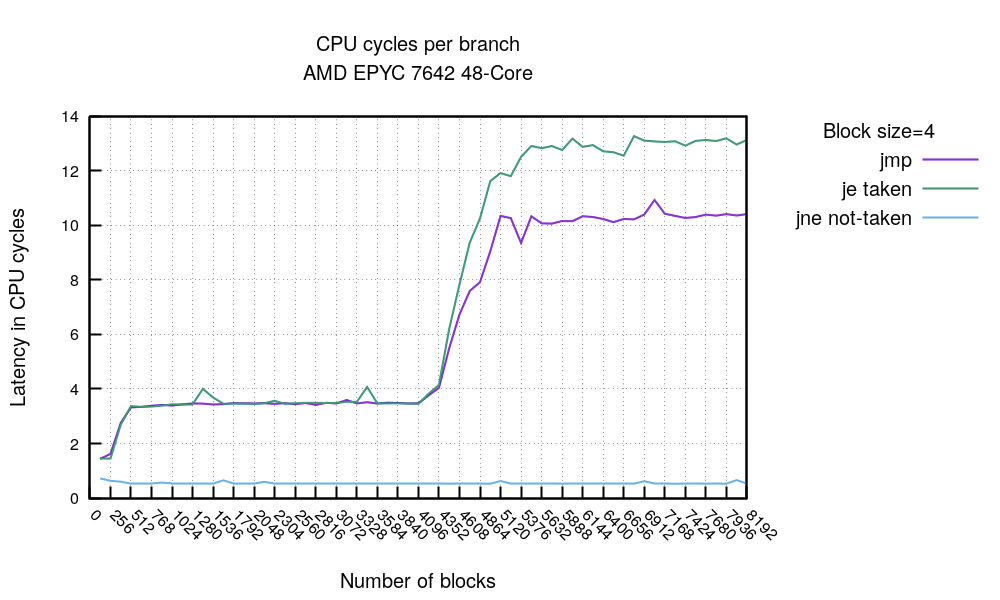
Let's bring this experiment forward, what if we took the best times of each run - with a fully primed BTB - for varying values of jmp block sizes and number of blocks - working set size? Here you go:
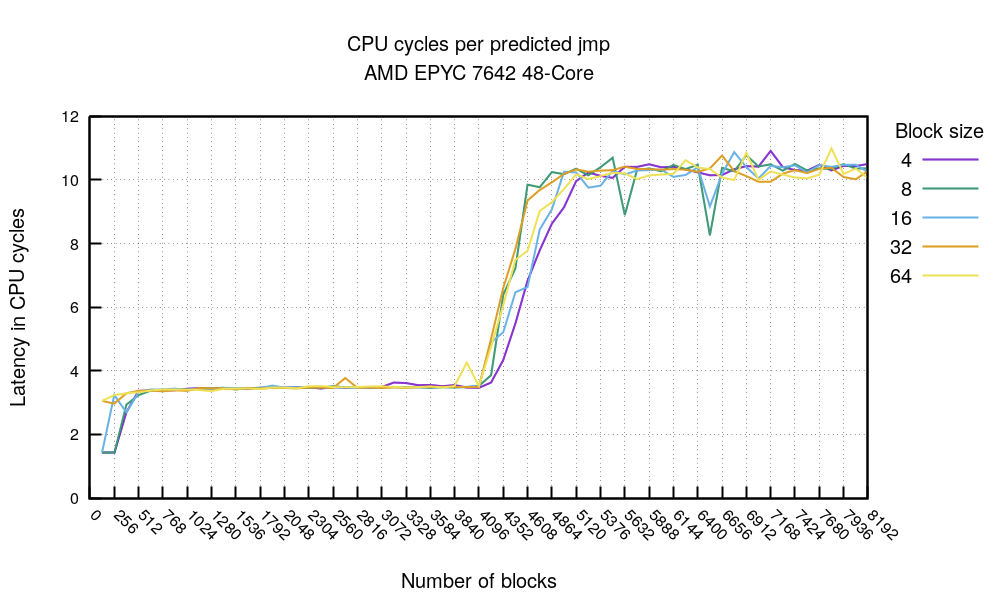
This is an astonishing chart. First, it's obvious something happens at the 4096 jmp mark[4] regardless of how large the jmp block sizes - how many nop's we skip over. Reading it aloud:
- On the far left, we see that if the amount of code is small enough - less than 2048 bytes (256 times a block of 8 bytes) - it's possible to hit some kind of uop/L1 cache and get ~1.5 cycles per fully predicted branch. This is amazing.
- Otherwise, if you keep your hot loop to 4096 branches then, no matter how dense your code is you are likely to see ~3.4 cycles per fully predicted branch
- Above 4096 branches the branch predictor gives up and the cost of each branch shoots to ~10.5 cycles per jmp. This is consistent with what we saw above - unpredicted branch on flushed BTB took ~10.5 cycles.
Great, so what does it mean? Well, you should avoid branch instructions if you want to avoid branch misses because you have at most 4096 of fast BTB slots. This is not a very pragmatic advice though - it's not like we deliberately put many unconditional jmps in real code!
There are a couple of takeaways for the discussed CPU. I repeated the experiment with an always-taken conditional branch sequence and the resulting chart looks almost identical. The only difference being the predicted taken conditional-je instruction being 2 cycles slower than unconditional jmp.
An entry to BTB is added wherever a branch is "taken" - that is, the jump actually happens. An unconditional "jmp" or always taken conditional branch, will cost a BTB slot. To get best performance make sure to not have more than 4096 taken branches in the hot loop. The good news is that branches never-taken don't take space in the BTB. We can illustrate this with another experiment:
This boring code is going over not-taken jne followed by two nops (block size=4). Aimed with this test (jne never-taken), the previous one (jmp always-taken) and a conditional branch je always-taken, we can draw this chart:
First, without any surprise we can see the conditional 'je always-taken' is getting slightly more costly than the simple unconditional jmp, but only after the 4096 branches mark. This makes sense, the conditional branch is resolved later in the pipeline so the frontend bubble is longer. Then take a look at the blue line hovering near zero. This is the "jne never-taken" line flat at 0.3 clocks / block, no matter how many blocks we run in sequence. The takeaway is clear - you can have as many never-taken branches as you want, without incurring any cost. There isn't any spike at 4096 mark, meaning BTB is not used in this case. It seems the conditional jump not seen before is guessed to be not-taken.
Top tip 2: conditional branches never-taken are basically free - at least on this CPU.
So far we established that branches always-taken occupy BTB, branches never taken do not. How about other control flow instructions, like the call?
I haven't been able to find this in the literature, but it seems call/ret also need the BTB entry for best performance. I was able to illustrate this on our AMD EPYC. Let's take a look at this test:
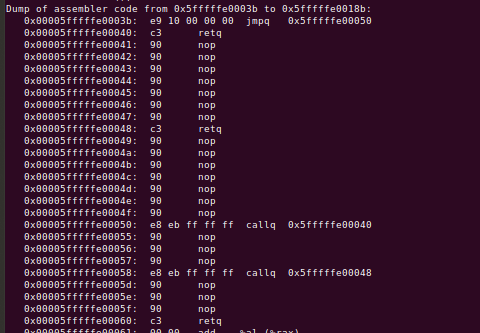
This time we'll issue a number of callq instructions followed by ret - both of which should be fully predicted. The experiment is crafted so that each callq calls a unique function, to allow for retq prediction - each one returns to exactly one caller.
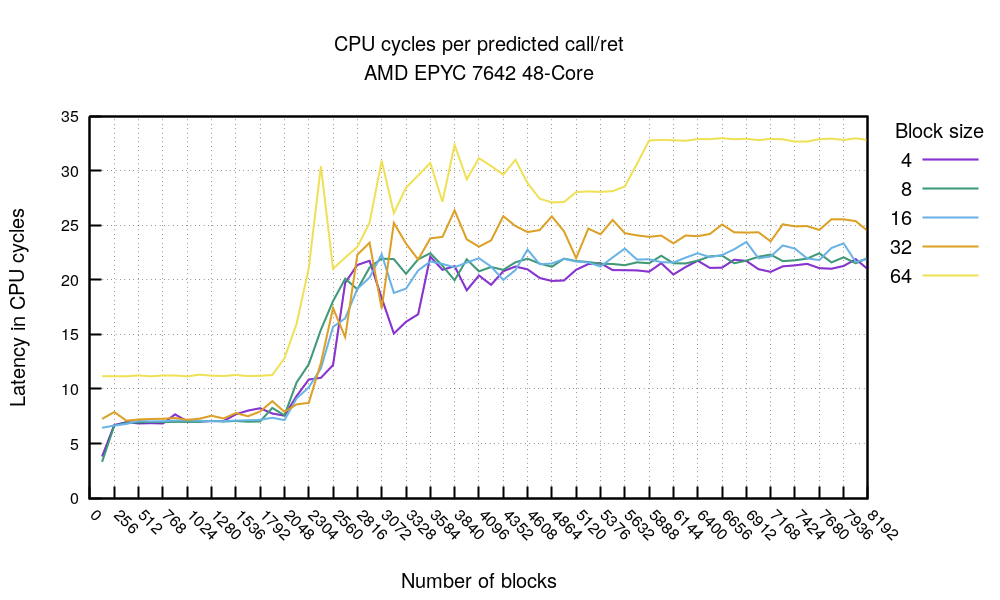
This chart confirms the theory: no matter the code density - with the exception of 64-byte block size being notably slower - the cost of predicted call/ret starts to deteriorate after the 2048 mark. At this point the BTB is filled with call and ret predictions and can't handle any more data. This leads to an important conclusion:
Top tip 3. In the hot code you want to have less than 2K function calls - on this CPU.
In our test CPU a sequence of fully predicted call/ret takes about 7 cycles, which is about the same as two unconditional predicted jmp opcodes. It's consistent with our results above.
So far we thoroughly checked AMD EPYC 7642. We started with this CPU because the branch predictor is relatively simple and the charts were easy to read. It turns out more recent CPUs are less clear.
AMD EPYC 7713
Newer AMD is more complex than the previous generations. Let's run the two most important experiments. First, the jmp one:
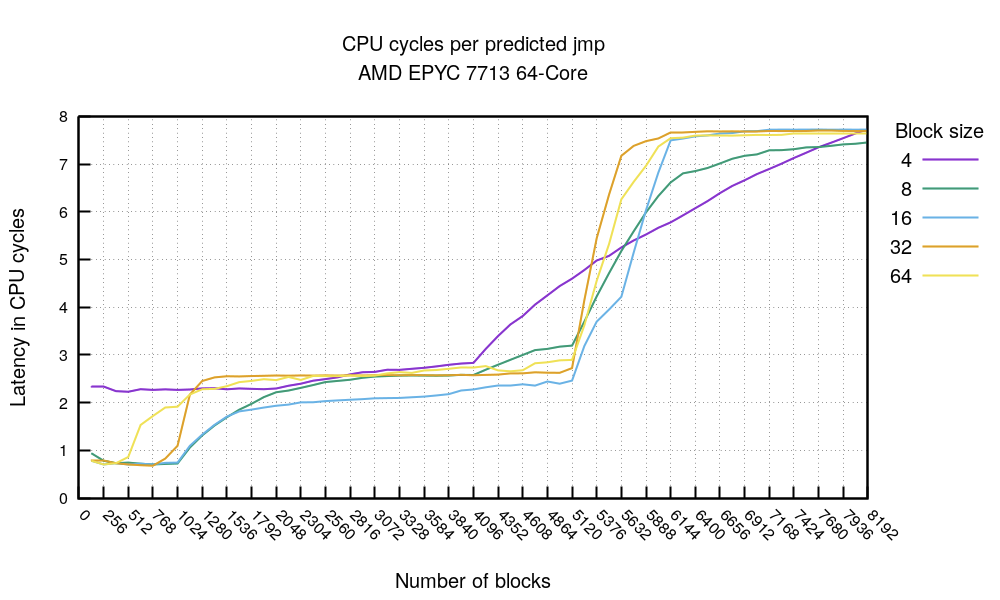
For the always-taken branches case we can see a very good, sub 1 cycle, timings when the number of branches doesn't exceed 1024 and the code isn't too dense.
Top tip 4. On this CPU it's possible to get <1 cycle per predicted jmp when the hot loop fits in ~32KiB.
Then there is some noise starting after the 4096 jmps mark. This is followed by a complete drop of speed at about 6000 branches. This is in line with the theory that BTB is 4096 entries long. We can speculate that some other prediction mechanism is successfully kicking in beyond that, and keeps up the performance up the ~6k mark.
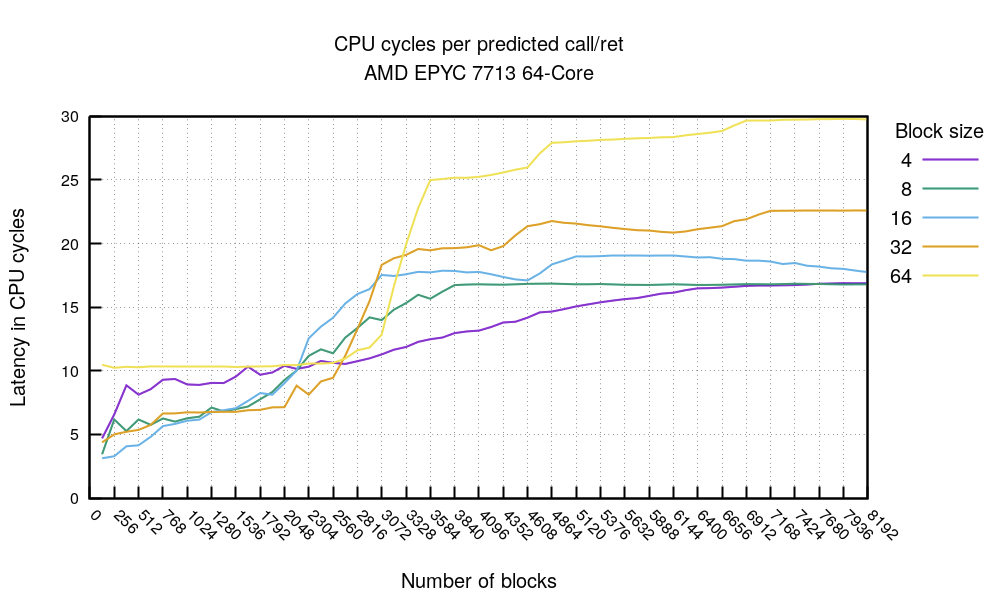
The call/ret chart shows a similar tale, the timings start breaking after 2048 mark, and completely fail to be predicted beyond ~3000.
Xeon Gold 6262
The Intel Xeon looks different from the AMD:
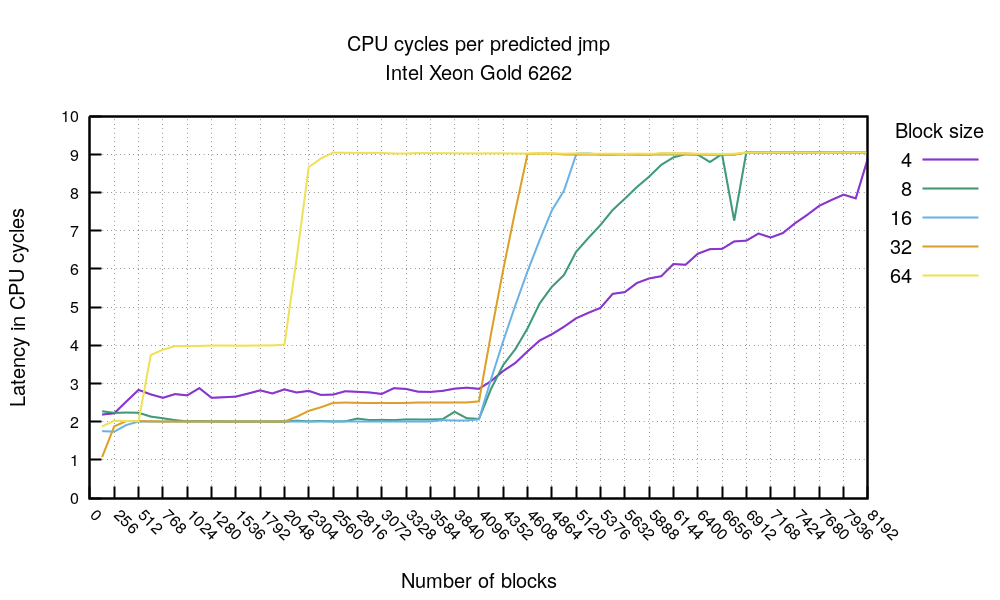
Our test shows the predicted taken branch costs 2 cycles. Intel has documented a clock penalty for very dense branching code - this explains the 4-byte block size line hovering at ~3 cycles. The branch cost breaks at the 4096 jmp mark, confirming the theory that the Intel BTB can hold 4096 entries. The 64-byte block size chart looks confusing, but really isn't. The branch cost stays at flat 2 cycles up till the 512 jmp count. Then it increases. This is caused by the internal layout of the BTB which is said to be 8-way associative. It seems with the 64-byte block size we can utilize at most half of the 4096 BTB slots.
Top tip 5. On Intel avoid placing your jmp/call/ret instructions at regular 64-byte intervals.
Then the call/ret chart:
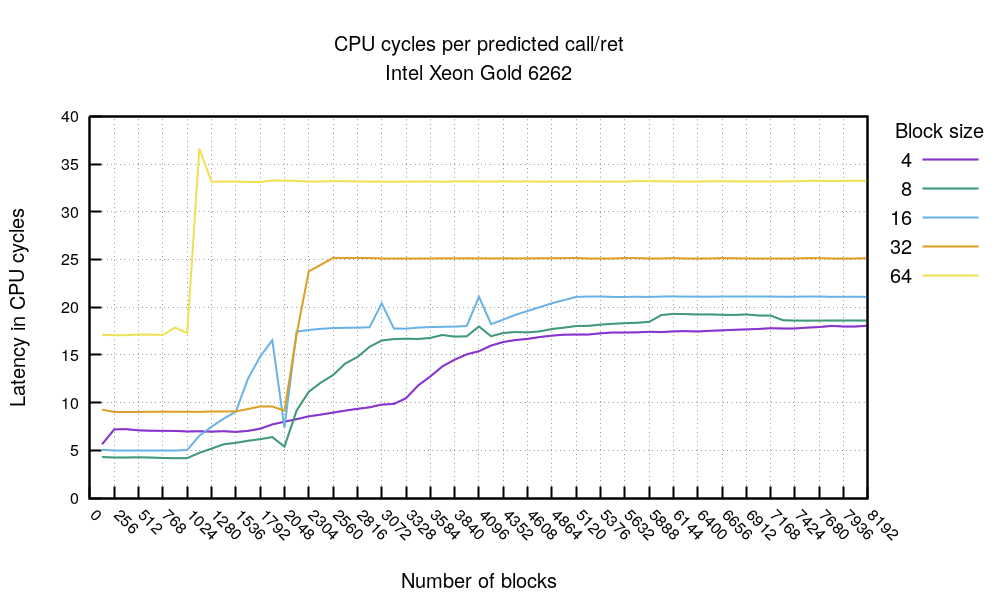
Similarly, we can see the branch predictions failing after the 2048 jmp mark - in this experiment one block uses two flow control instructions: call and ret. This again confirms the BTB size of 4K entries. The 64-byte block size is generally slower due to the nop padding but also breaks faster due to the instructions alignment issue. Notice, we haven't seen this effect on AMD.
Apple Silicon M1
So far we saw examples of AMD and Intel server grade CPUs. How does an Apple Silicon M1 fit in this picture?
We expect it to be very different - it's designed for mobile and it's using ARM64 architecture. Let's see our two experiments:
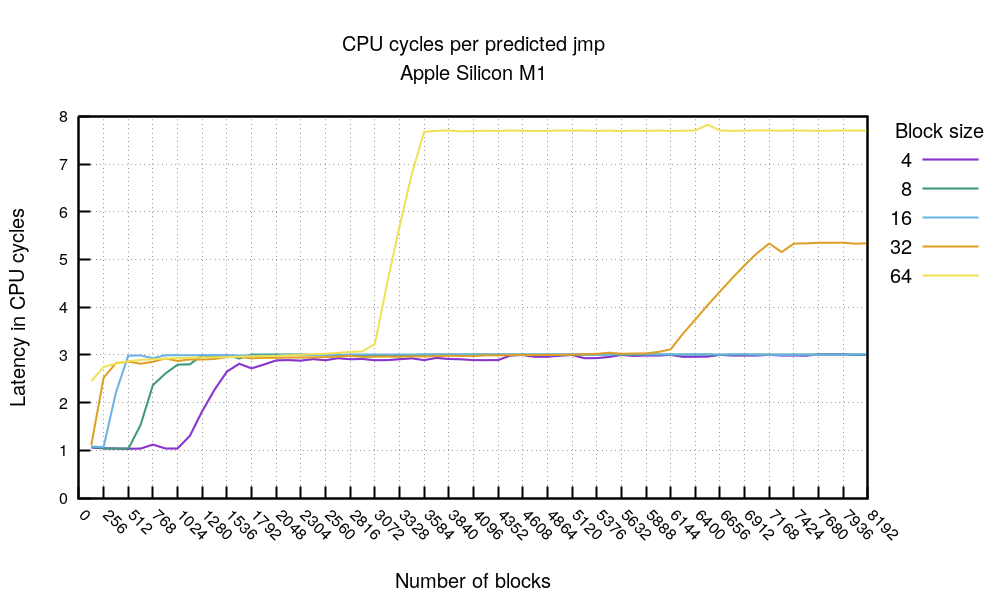
The predicted jmp test shows an interesting story. First, when the code fits 4096 bytes (1024*4 or 512*8, etc) you can expect a predicted jmp to cost 1 clock cycle. This is an excellent score.
Beyond that, generally, you can expect a cost of 3 clock cycles per predicted jmp. This is also very good. This starts to deteriorate when the working code grows beyond ~200KiB. This is visible with block size 64 breaking at 3072 mark 3072*64=196K, and for block 32 at 6144: 6144*32=196K. At this point the prediction seems to stop working. The documentation indicates that the M1 CPU has 192 KB L1 of instruction cache - our experiment matches that.
Let's compare the "predicted jmp" with the "unpredicted jmp" chart. Take this chart with a grain of salt, because flushing the branch predictor is notoriously difficult.
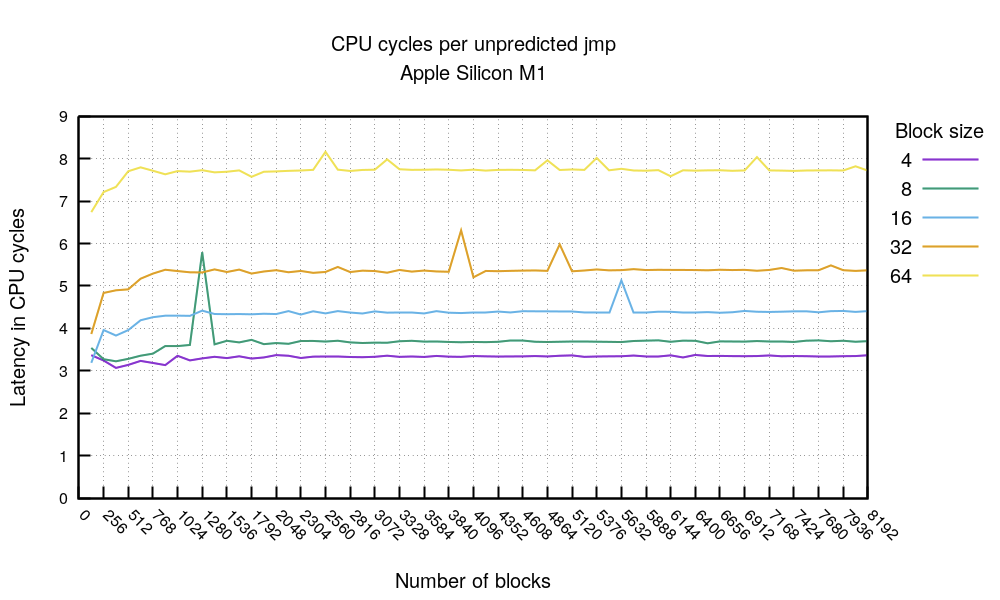
However, even if we don't trust the flush-bpu code (adapted from Matt Godbolt), this chart reveals two things. First, the "unpredicted" branch cost seems to be correlated with the branch distance. The longer the branch the costlier it is. We haven't seen such behaviour on x86 CPUs.
Then there is the cost itself. We saw a predicted sequence of branches cost, and what a supposedly-unpredicted jmp costs. In the first chart we saw that beyond ~192KiB working code, the branch predictor seems to become ineffective. The supposedly-flushed BPU seems to show the same cost. For example, the cost of a 64-byte block size jmp with a small working set size is 3 cycles. A miss is ~8 cycles. For a large working set size both times are ~8 cycles. It seems that the BTB is linked to the L1 cache state. Paul A. Clayton suggested a possibility of such a design back in 2016.
Top tip 6. on M1 the predicted-taken branch generally takes 3 cycles and unpredicted but taken has varying cost, depending on jmp length. BTB is likely linked with L1 cache.
The call/ret chart is funny:
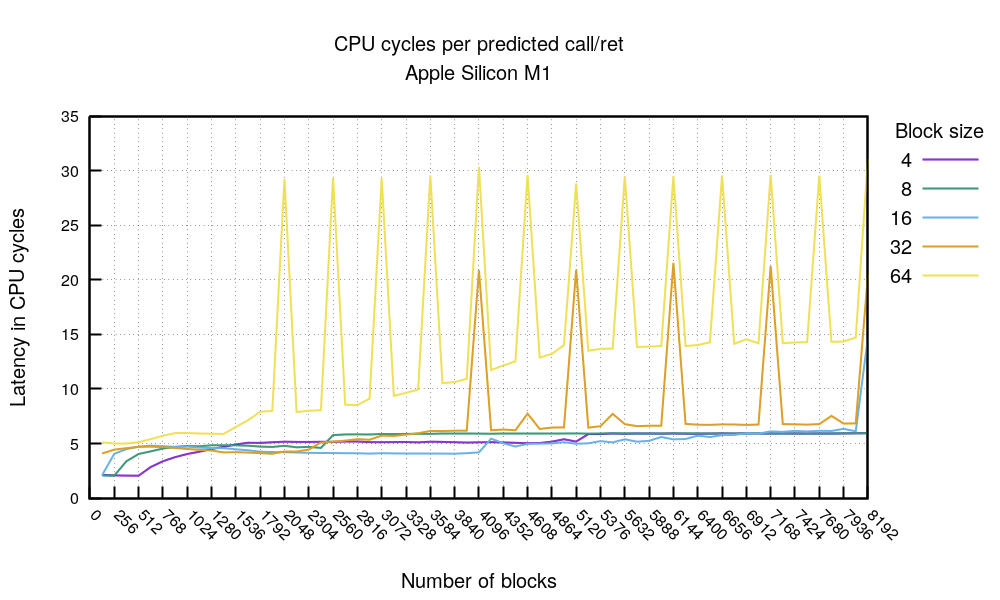
Like in the chart before, we can see a big benefit if hot code fits within 4096 bytes (512*4 or 256*8). Otherwise, you can count on 4-6 cycles per call/ret sequence (or, bl/ret as it's known in ARM). The chart shows funny alignment issues. It's unclear what they are caused by. Beware, comparing the numbers in this chart with x86 is unfair, since ARM call operation differs substantially from the x86 variant.
M1 seems pretty fast, with predicted branches usually at 3 clock cycles. Even unpredicted branches never cost more than 8 ticks in our benchmark. Call+ret sequence for dense code should fit under 5 cycles.
Summary
We started our journey from a piece of trivial code, and asked a basic question: how costly is adding a never-taken if branch in the hot portion of code?
Then we quickly dived in very low level CPU features. By the end of this article, hopefully, an astute reader might get better intuition how a modern branch predictors works.
On x86 the hot code needs to split the BTB budget between function calls and taken branches. The BTB has only a size of 4096 entries. There are strong benefits in keeping the hot code under 16KiB.
On the other hand on M1 the BTB seems to be limited by L1 instruction cache. If you're writing super hot code, ideally it should fit 4KiB.
Finally, can you add this one more if statement? If it's never-taken, it's probably ok. I found no evidence that such branches incur any extra cost. But do avoid always-taken branches and function calls.
Sources
I'm not the first person to investigate how BTB works. I based my experiments on:
- Vladimir Uzelac thesis
- Matt Godbolt work. The series has 5 articles.
- Travis Downs BTB questions on Real World Tech
- various stackoverflow discussions. Especially this one and this
- Agner Fog microarchitecture guide has a good section on branch predictions.
Acknowledgements
Thanks to David Wragg and Dan Luu for technical expertise and proofreading help.
PS
Oh, oh. But this is not the whole story! Similar research was the base to the Spectre v2 attack. The attack was exploiting the little known fact that the BPU state was not cleared between context switches. With the correct technique it was possible to train the BPU - in the case of Spectre it was iBTB - and force a privileged piece of code to be speculatively executed. This, combined with a cache side-channel data leak, allowed an attacker to steal secrets from the privileged kernel. Powerful stuff.
A proposed solution was to avoid using shared BTB. This can be done in two ways: make the indirect jumps to always fail to predict, or fix the CPU to avoid sharing BTB state across isolation domains. This is a long story, maybe for another time...
1. One historical solution to this specific 'if debug' problem is called "runtime nop'ing". The idea is to modify the code in runtime and patch the never-taken branch instruction with a nop. For example, see the "ISENABLED" discussion on https://bugzilla.mozilla.org/showbug.cgi?id=370906.
2. Fun fact: modern compilers are pretty smart. New gcc (>=11) and older clang (>=3.7) are able to actually optimize it quite a lot. See for yourself. But, let's not get distracted by that. This article is about low level machine code branch instructions!
3. This is a simplification. There are of course more control flow instructions, like: software interrupts, syscalls, VMENTER/VMEXIT.
4. Ok, I'm slightly overinterpreting the chart. Maybe the 4096 jmp mark is due to the 4096 uop cache or some instruction decoder artifact? To prove this spike is indeed BTB related I looked at Intel BPUCLEARS.EARLY and BACLEAR.CLEAR performance counters. Its value is small for block count under 4096 and large for block count greater than 5378. This is strong evidence that the performance drop is indeed caused by the BPU and likely BTB.